
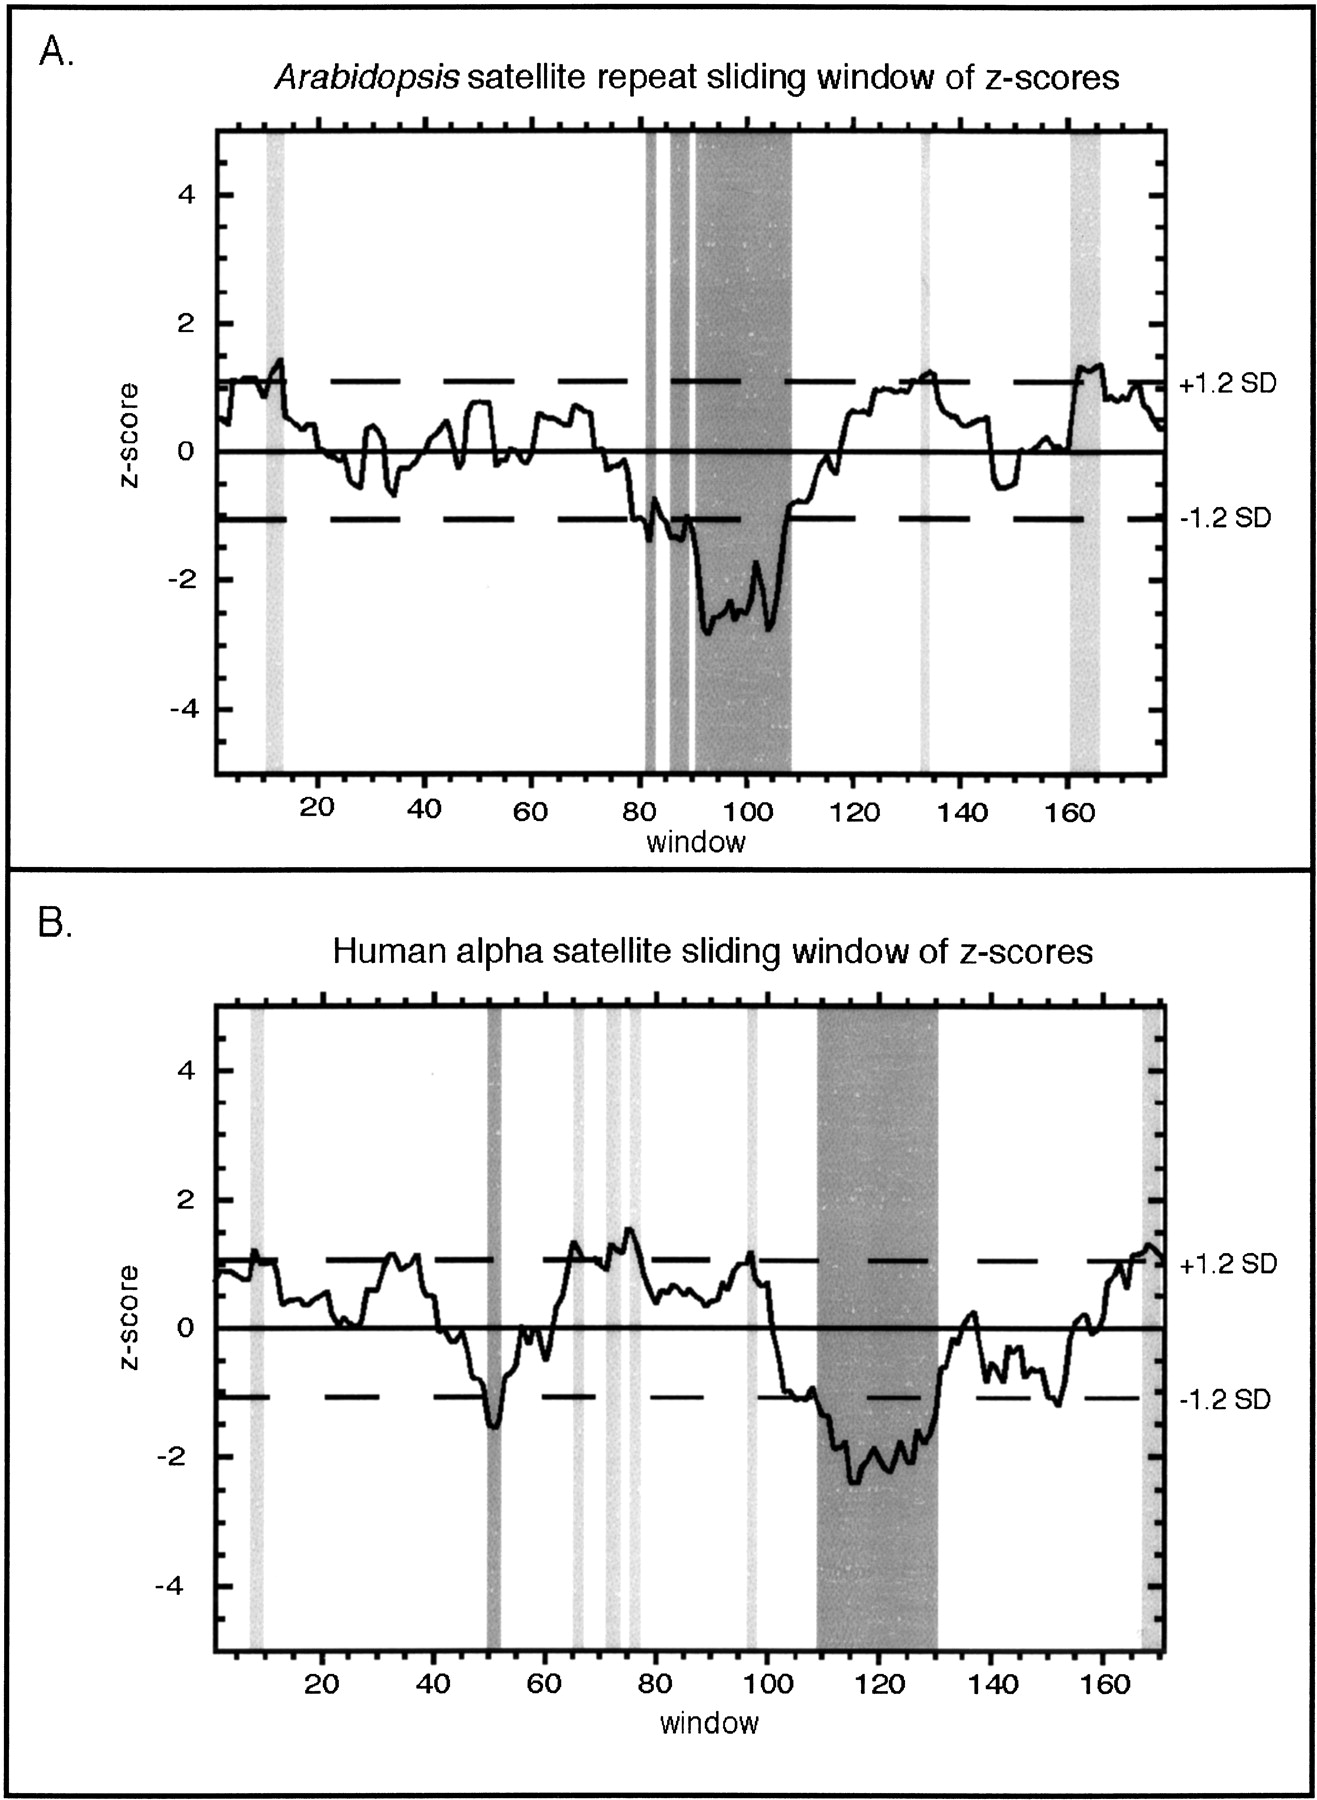
Figure 3.
Identification of significantly conserved and variable domains. The percent occurrence of the most frequent base (Fig. 2A,C) was subjected to a z-score analysis, measured over a sliding window of 15 bp. This process sets the average at zero (solid line); dashed lines indicate ±1.2 SD. Significantly conserved windows (light gray) and significantly variable regions (dark gray) were merged when the sliding windows overlapped, and the entire window was represented as conserved (C1, C2, C3) and variable (V1, V2) regions (Figs. 1 and 2).


