
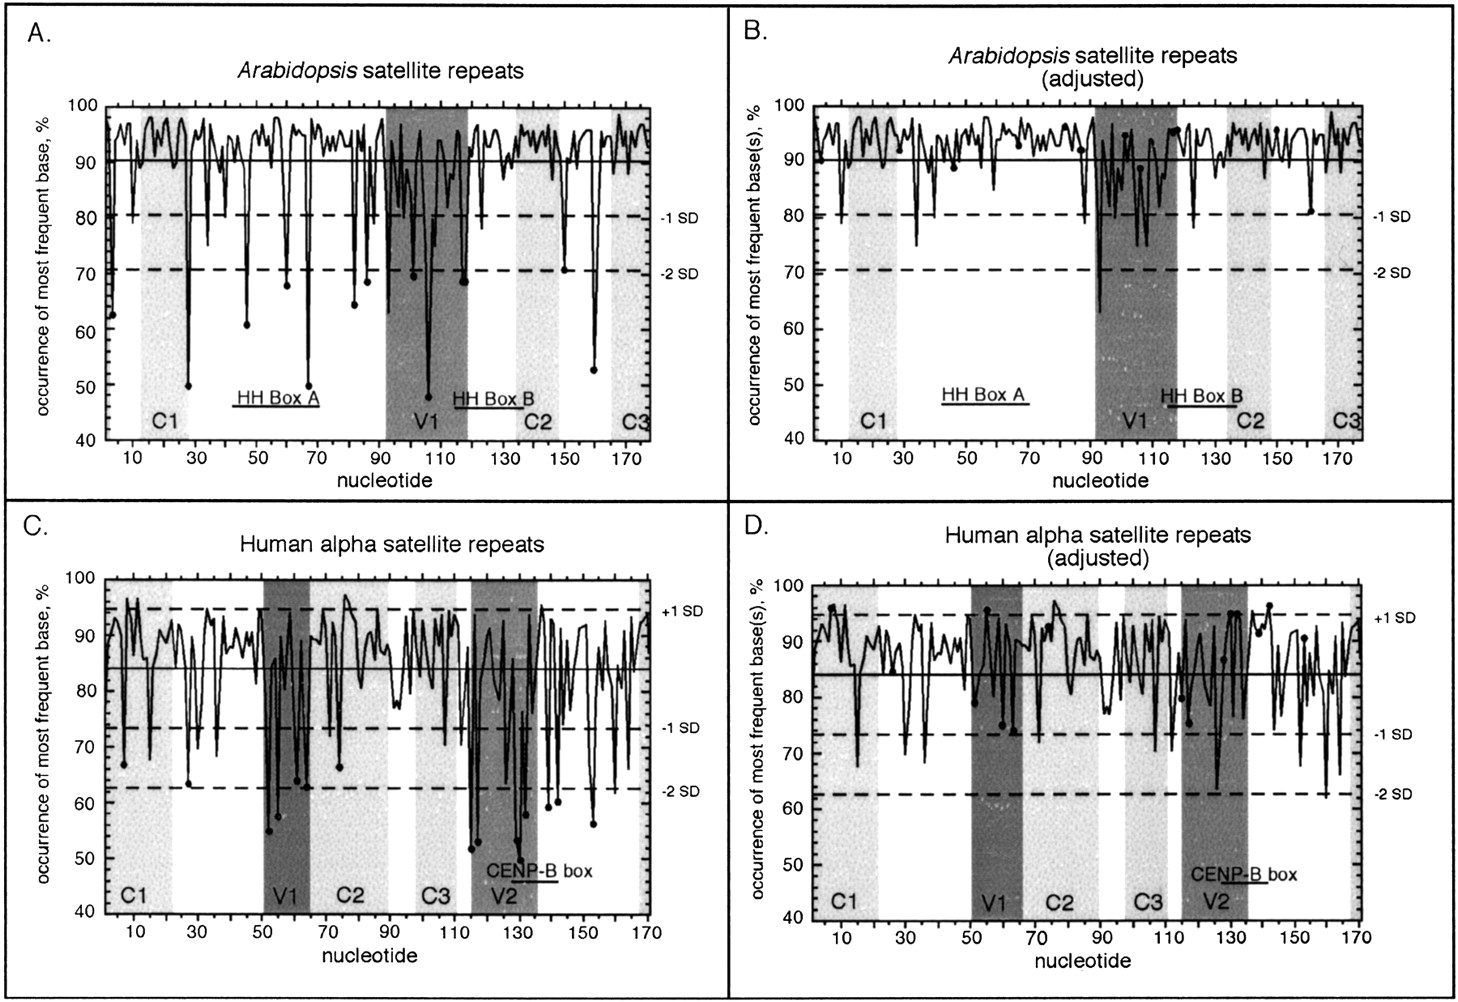
Variation across Arabidopsis and human satellite sequences. Percent occurrence of the most frequent base is plotted for each position in the Arabidopsis and α-satellite repeats, determined in the same manner for all nucleotides (A,C), or adjusted (B,D) by adding the frequencies of all the nucleotides that contributed to polymorphic sites (filled circles). (Solid line) The average percent occurrence of the most frequent base across all nucleotides; (dashed lines) SD from the average; (gray shading) cConserved (C1, C2, C3) and variable (V1, V2) regions (see also Fig. 3). (HH Boxes A and B) Conserved regions in the Columbia ecotype (Heslop-Harrison et al 1999); (CENP-B box) the binding site for the centromere-binding protein B (Muro et al. 1992).


