
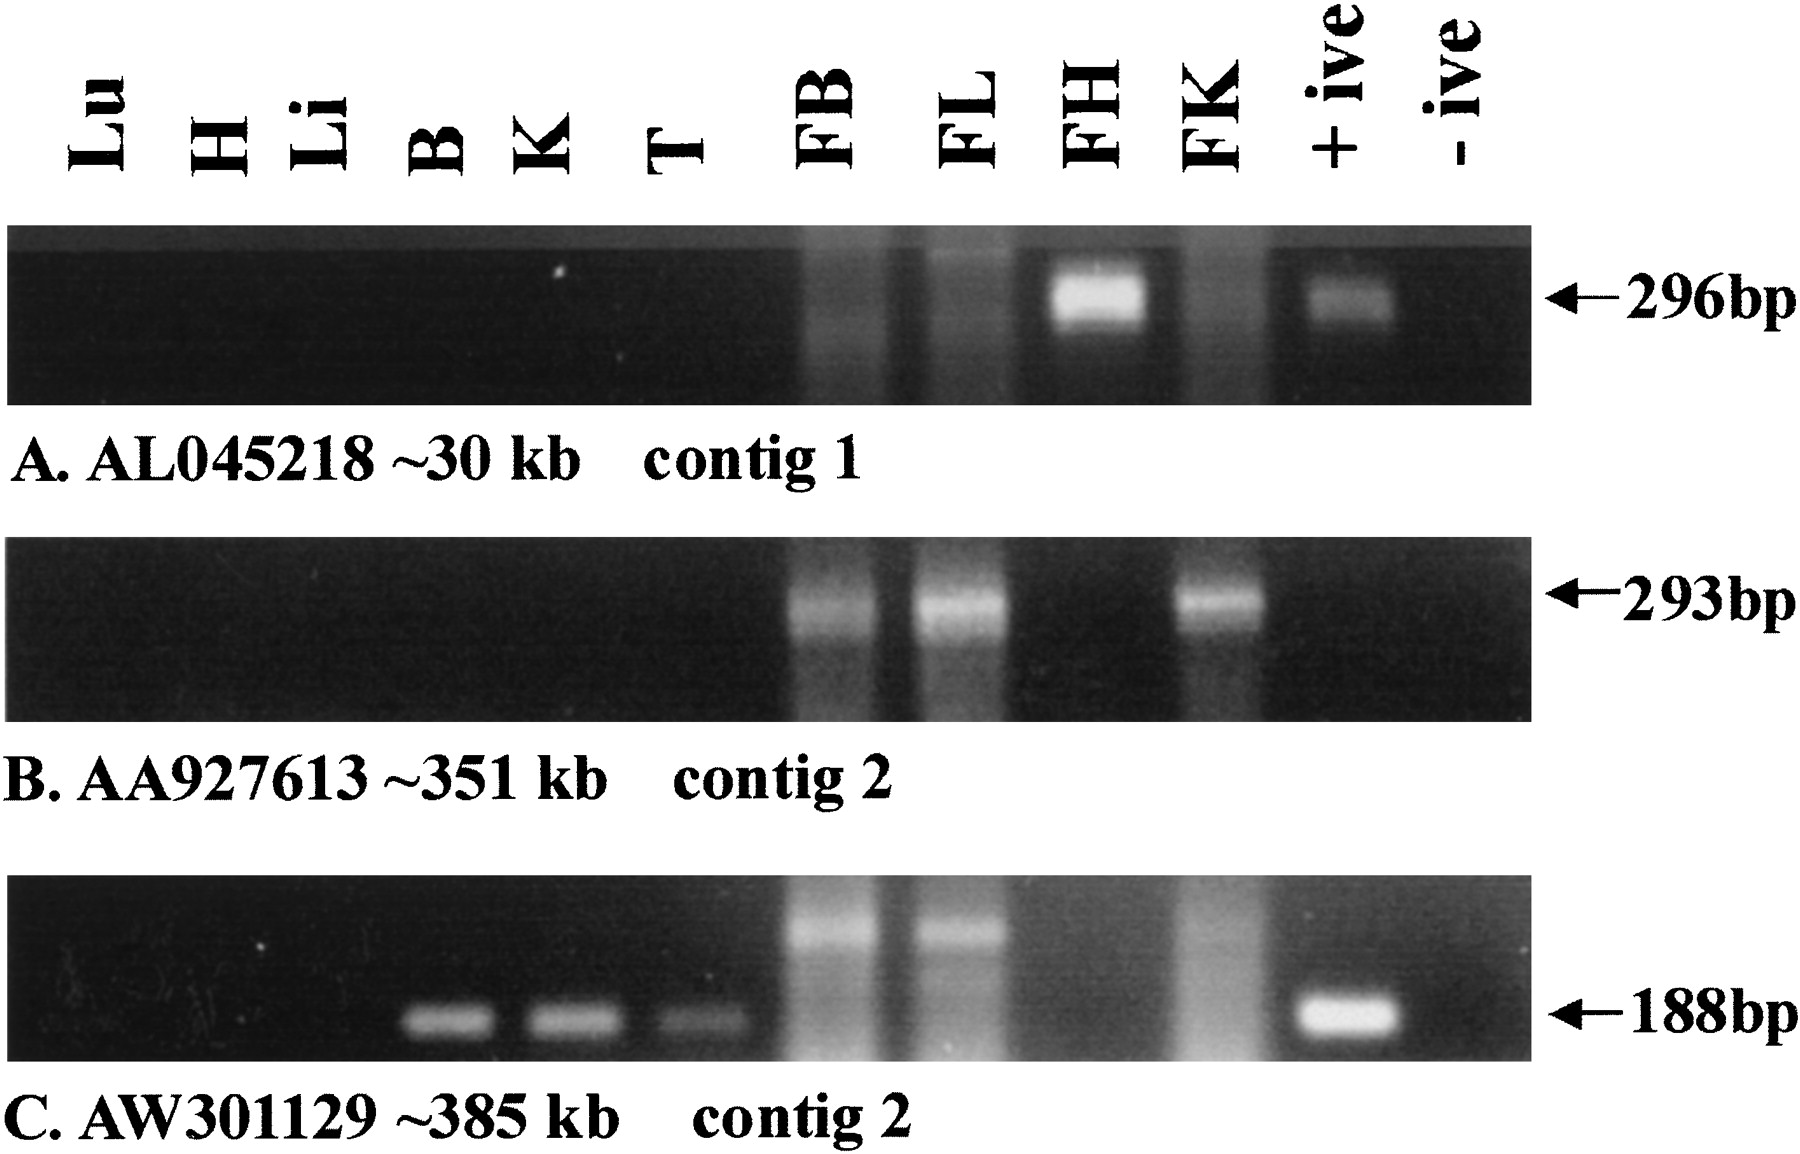
RT-PCR analysis of 10p11 ESTs. The tissue source of each cDNA used is shown above the panels (see Table 2 footnote). The EST accession number is given together with position in the sequence (contig 1 in parenthesis). The expected PCR product size is indicated with an arrow shown to the right of each panel. The (+ ive) control lane shown in all experimental panels is genomic DNA. No amplification is observed in the AA927631 genomic DNA control (B) as the expected size for this spliced EST is 13,248bp. The sequences amplified in (A) and (C) are contiguous with genomic DNA. The origin of the larger-than-expected amplification product in Fetal Brain and Fetal Heart (C) is unknown. Each experiment was performed in duplicate (not shown).


