
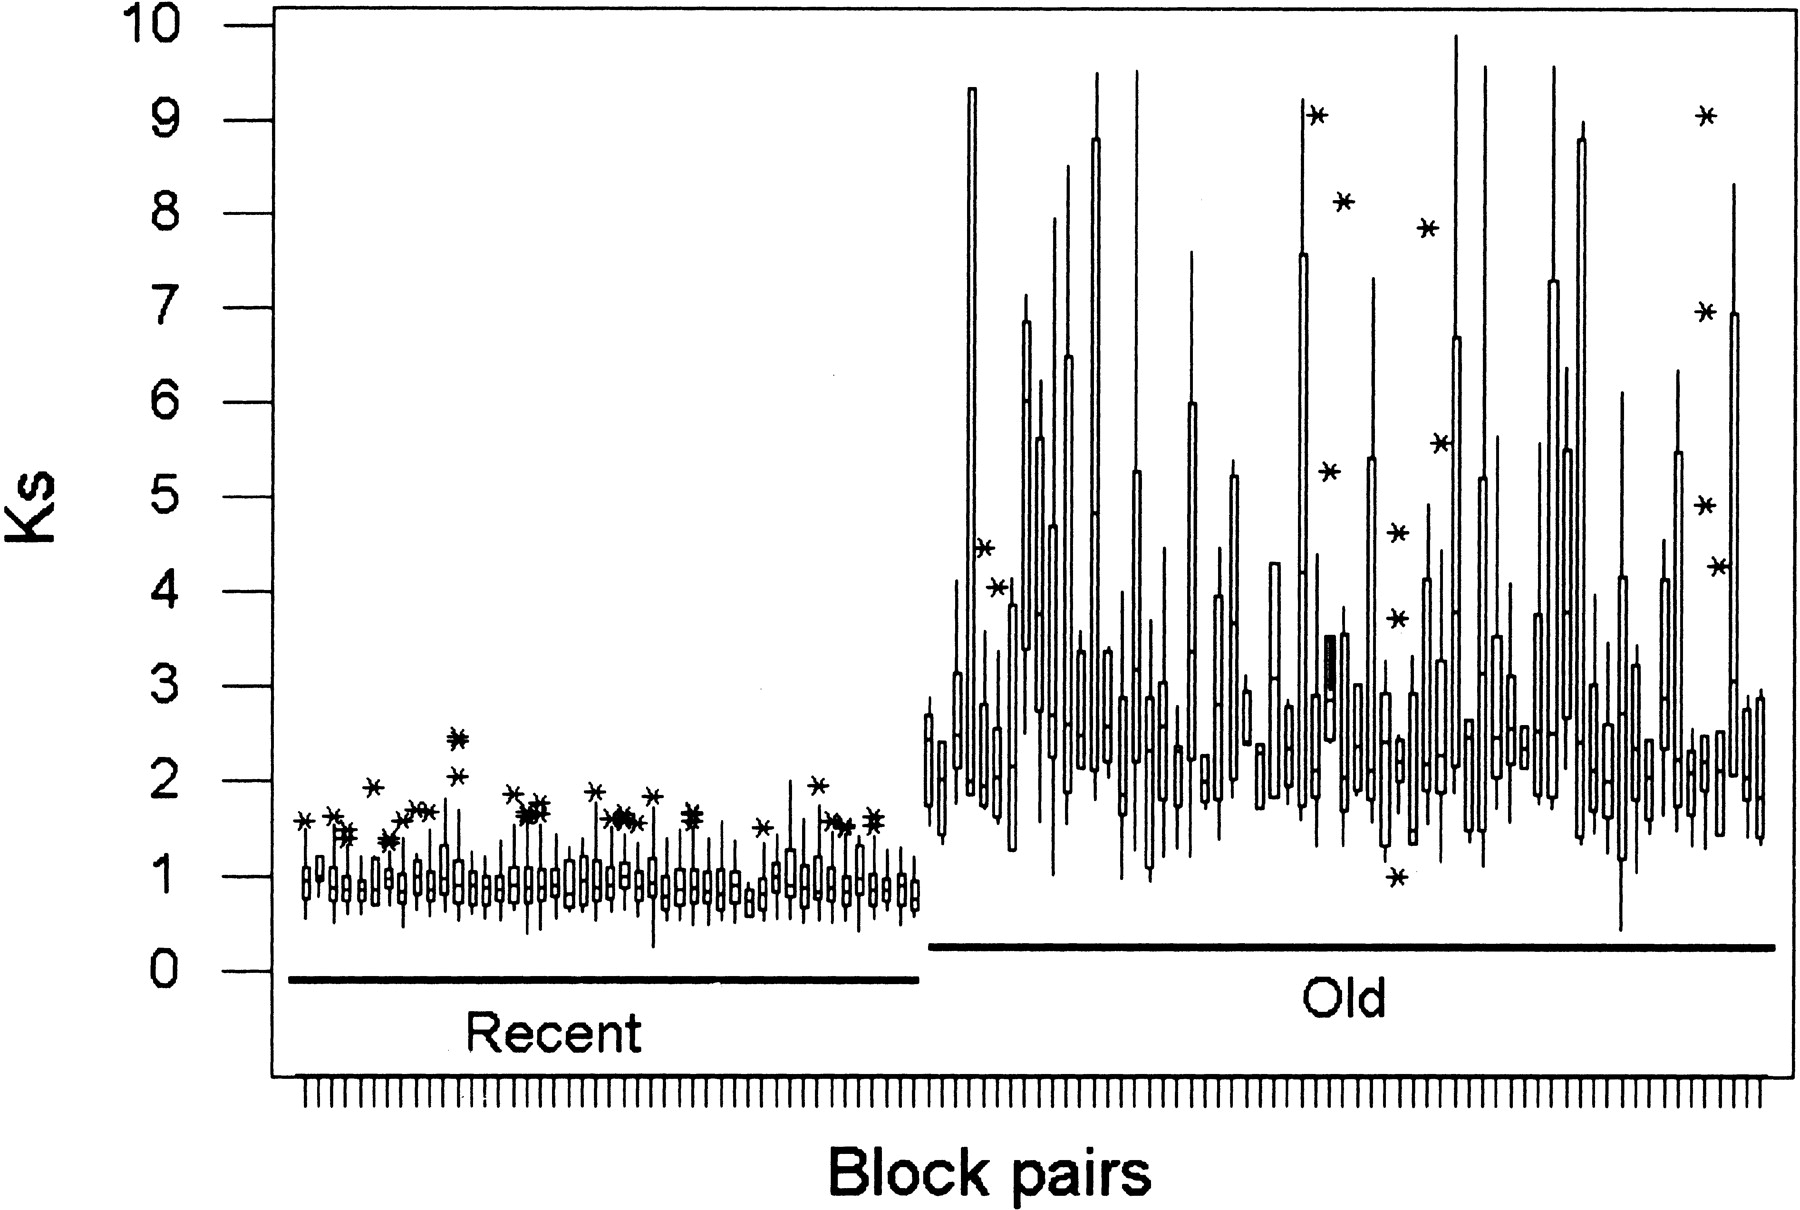
Figure 2.
Box plots of Ks values (Yang 1999) estimated from duplicated genes located in sister regions. The central box depicts the middle 50% of the data between the 25th and 75th percentile for each pair of duplicated blocks, and the enclosed horizontal line represents the median value of the distribution. Asterisks outside of the main bodies of data indicate extreme values.


