
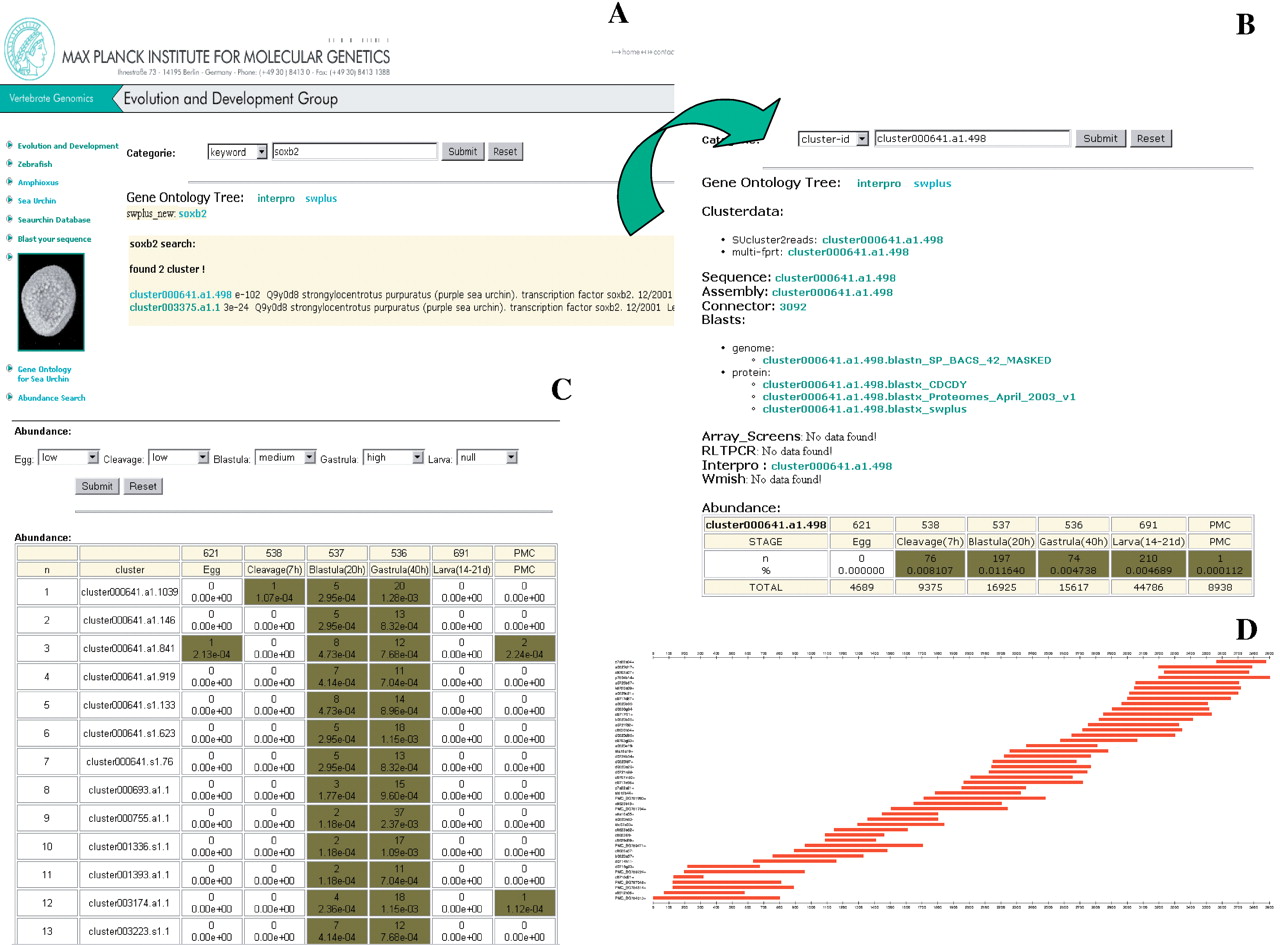
Example of the interface of the sea urchin database. (A) Using the Soxb2 gene name as a keyword, a list of clusters matching this query is displayed. (B) Selecting one of the listed clusters, all the information relevant for this cluster is displayed. By selecting the cluster data field, information such as all clonenames, read directions, trace identifiers, and so on for all the clones in the cluster are given. The number and percentage of all clones in the cluster as well as the developmental stage from which they are derived is displayed in the abundance field at the bottom, which allows a quick overview of when the gene of interest is expressed. (C) Furthermore, selection of EST clusters according to the developmental stage from which the respective cDNA clones were isolated can also be performed. As an example, a list of clusters consisting of clones expressed at low levels in the egg and cleavage stage, medium levels in blastula stage, and high levels in gastrula but not expressed in the larva is shown. (D) A graphical representation of the overlap of the ESTs assigned to an EST cluster is provided for each of the clusters contained in the database. As an example, the 3907-bp alignment of all 46 reads derived from 40 different clones of the cluster001767.a1.2 that represents a sea urchin ortholog of the Na+ and Cl- coupled neutral and basic amino acid transporter ATB0 (SWISS-PROT entry number: SP_RO:Q91Y60) is shown. Bars represent the EST sequences. On the left the sequencer trace identifiers are given, which can be used to retrieve a specific EST sequence.


