
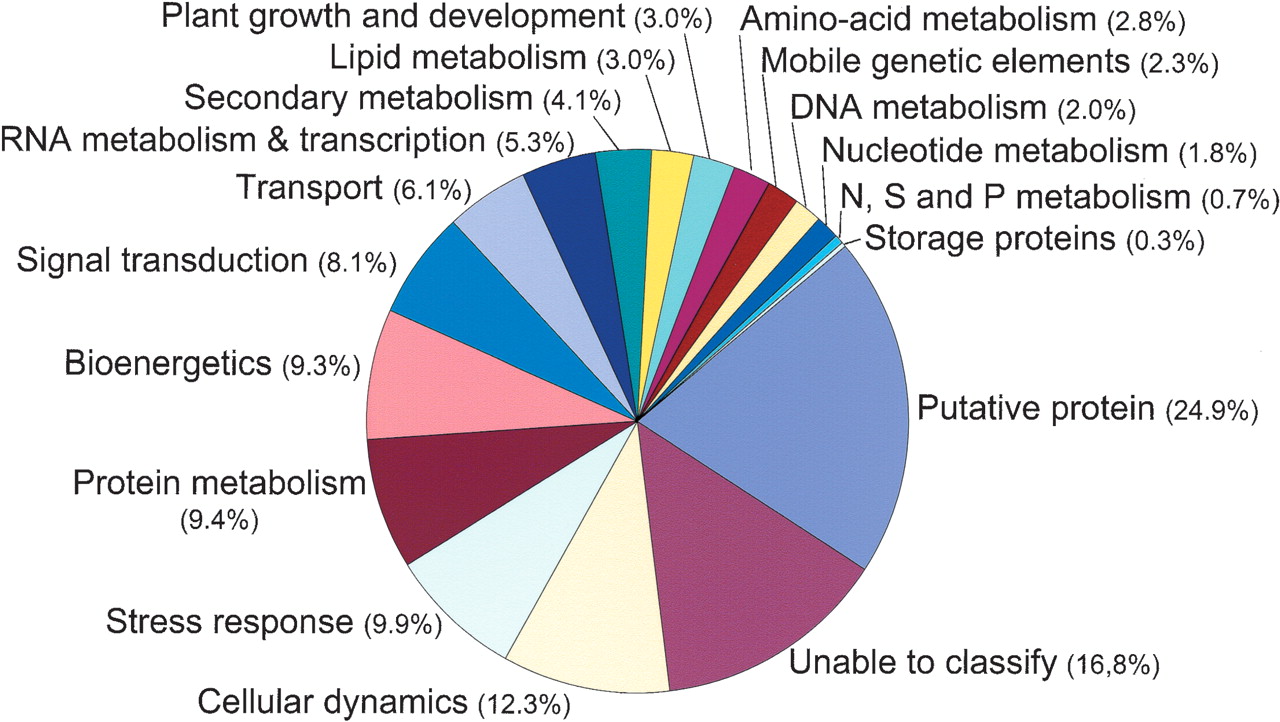
Sugarcane gene prediction classification. We classified 26,525 SASs with similarities to known protein sequences in the nonredundant protein (nr) database into 18 functional categories. The categories were generated either by automatic BLASTX of SASs against the categorized databases (cog.aa, http://www.ncbi.nlm.nih.gov/cgi-bin/COG/palog?fun=all; egad.aa, http://www.tigr.org/docs/tigr-scripts/egad_scripts/role_report.spl; kegg.aa, http://www.genome.ad.jp/kegg/kegg2.html; mips-at.aa, http://www.mips.biochem.mpg.-de/cgi-bin/proj/thal/filter_funcat.pl?all) or by manual inspection of BLASTX matches in the nr database by members of the SUCEST Consortium. In both cases, the BLASTX E-value cutoff was ≤10-5. The percentage of SASs found in each category is indicated next to the corresponding pie chart sector. The average percentages of SASs per category do not add up to 100% because some contigs or singletons appear in more than one category.


