
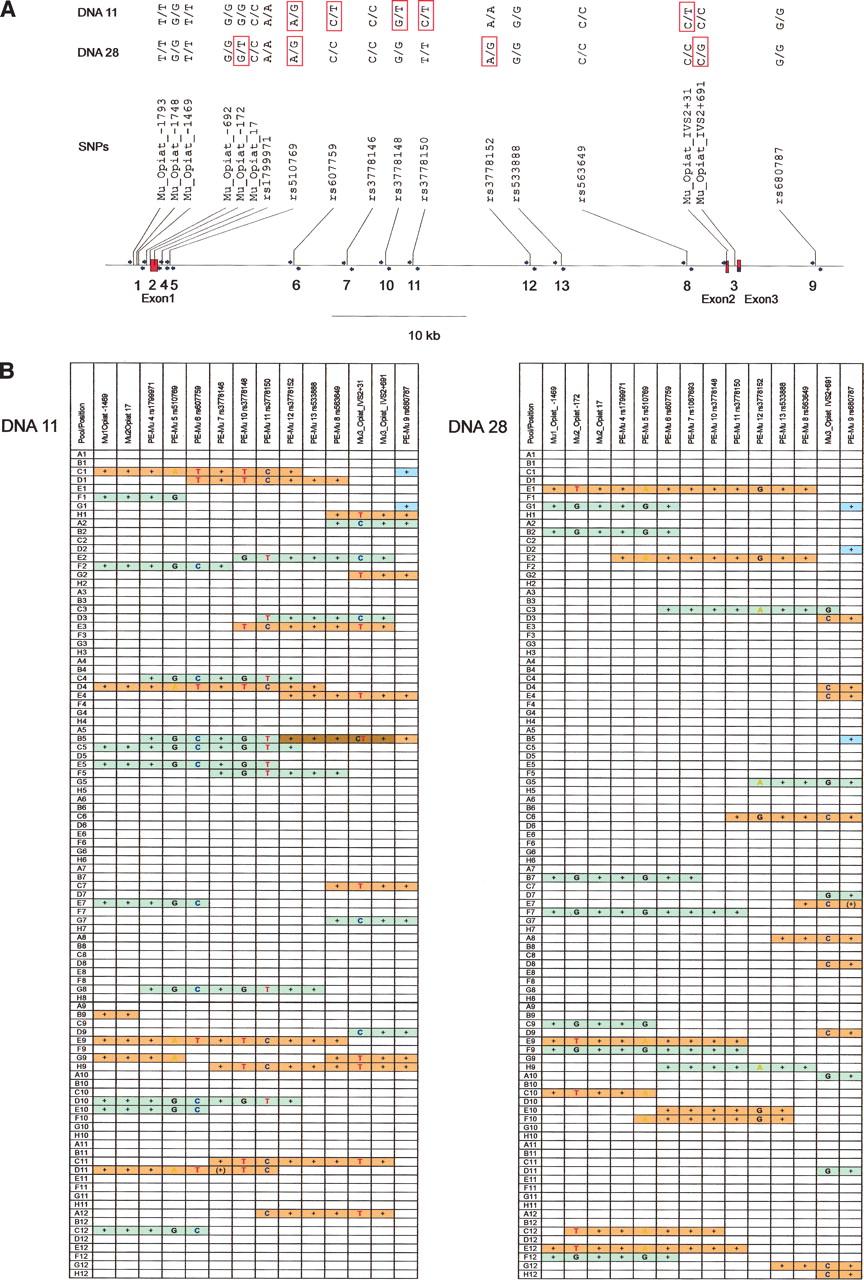
(A) Schematic drawing of the OPRM1 genomic region. SNPs are indicated and tagged with the published names (NCBI dbSNP-database; Hoehe et al. 2000). The genotypes of DNA11 and DNA28 are shown in the top lines. (B) Results for the haplotyping of DNA11 and DNA28. The different haplotypes are represented in red and green, respectively. A“+” indicates positive a PCR of SNPs that were previously found to be homozygous for DNA11 and DNA28, respectively. The letters A, C, G, and T denote the result of the haplotyping by the GOOD assay of the pools analyzed. Blue bars: pools where only homozygous SNPs are detected. Brown indicates the presence of two clones of different haplotypes in one pool.


