
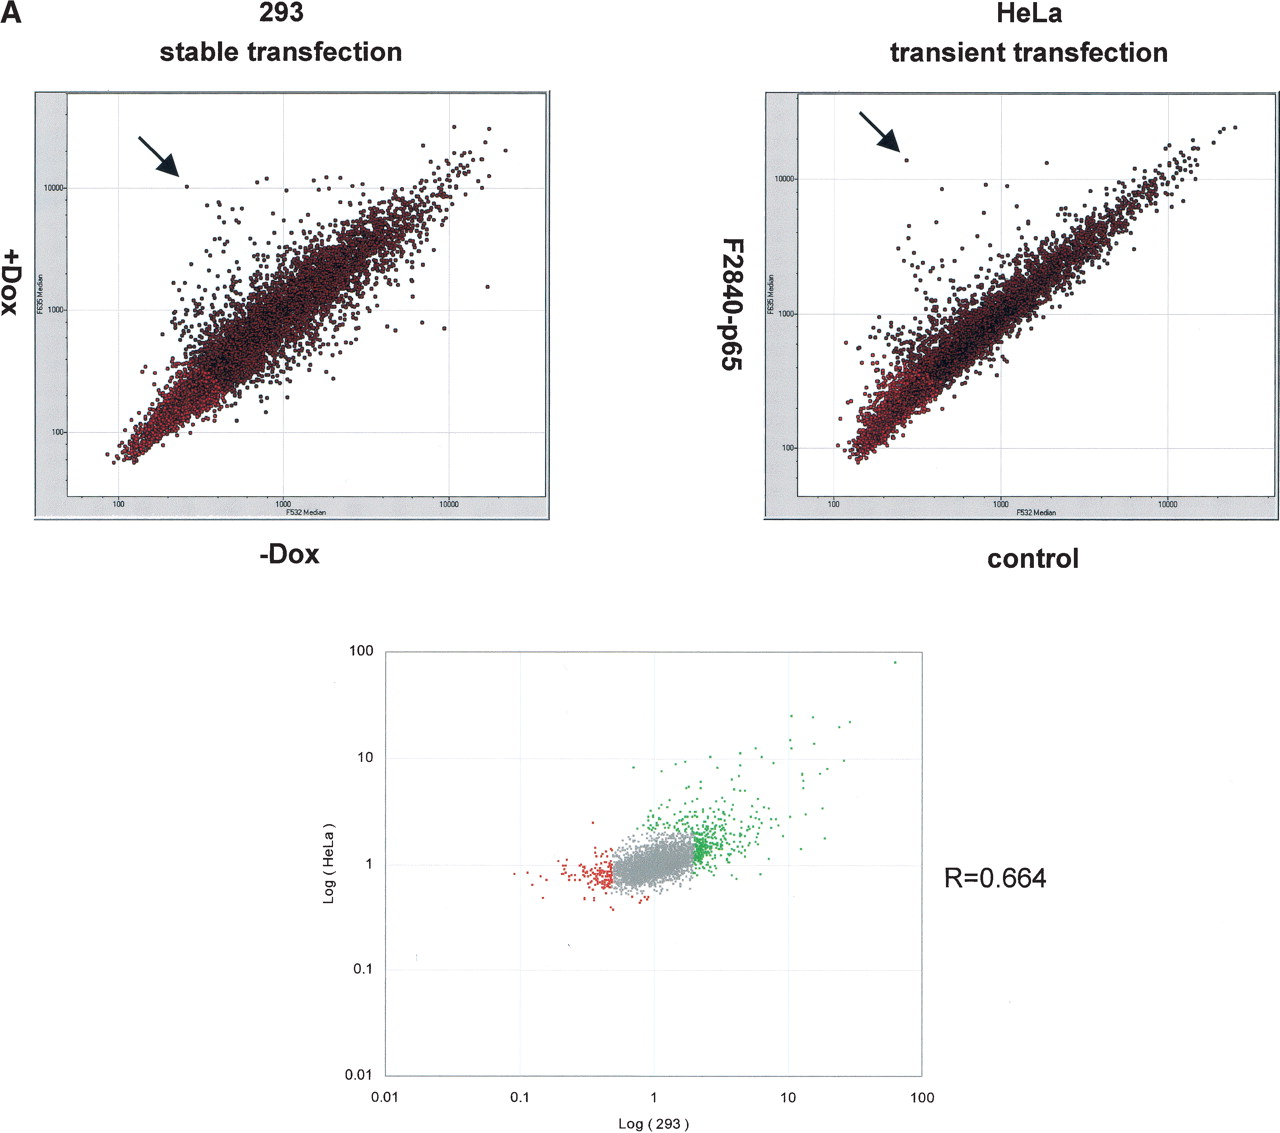
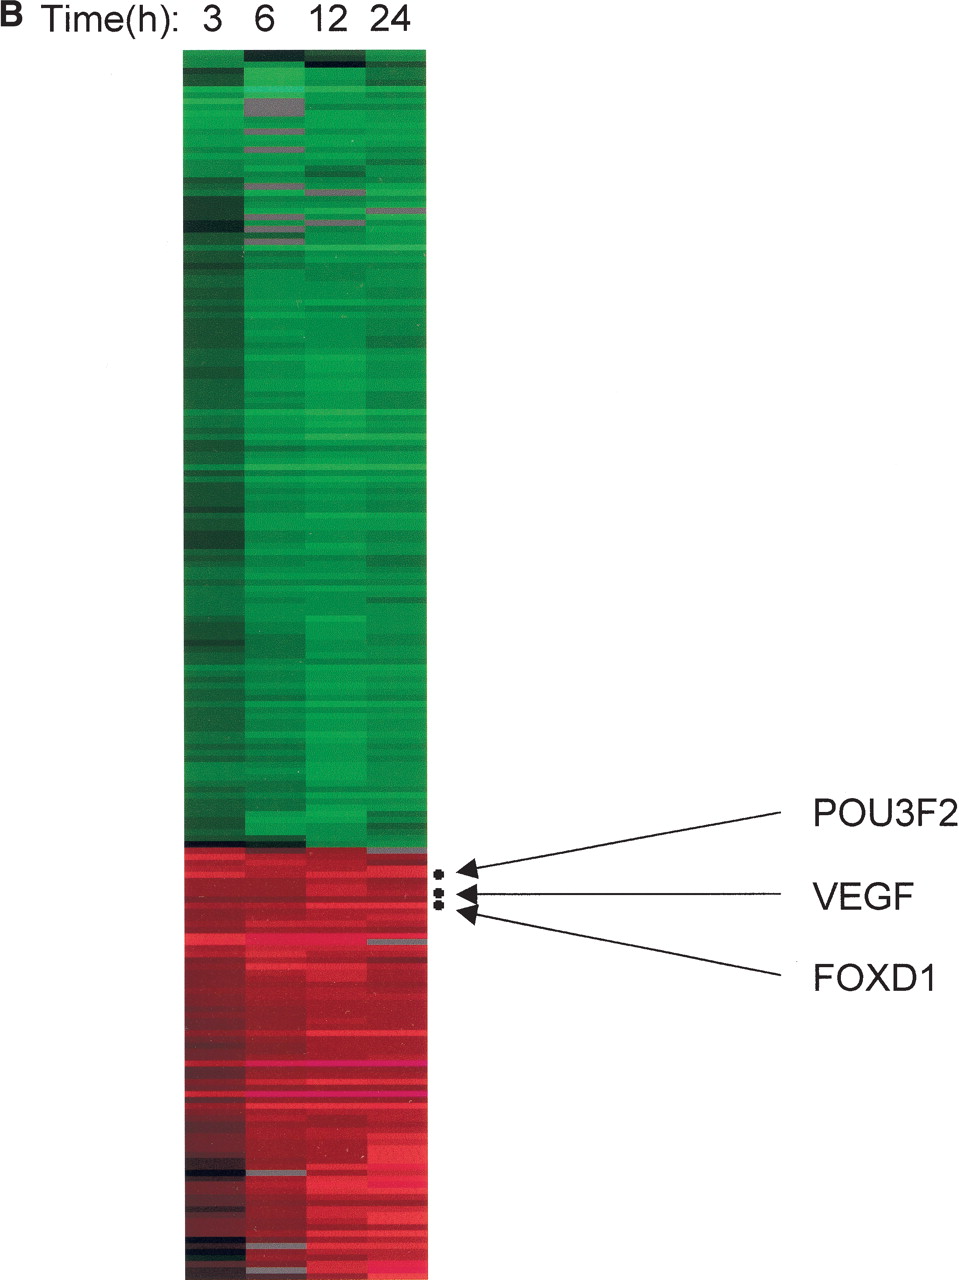
Characterization of a ZFP-TF-activated gene expression profile. (A) A gene expression profile obtained with a ZFP-TF in two different cell lines. A ZFP activator, F2840-p65, was either stably expressed in 293 cells (left) or transiently expressed in HeLa cells (right). In both experiments, insulin was highly expressed (marked by arrows). Dots colored in red were not subjected to analysis to avoid false results due to tailing. (Bottom) Plotting of the logarithmic expression ratios of each experiment and the correlation coefficient of two experiments. (B) Time-course analysis of gene expression driven by a ZFP-TF. A 293 cell line stably expressing a ZFP activator, F475-p65, was treated with Dox for the times stated. Genes identified as primary targets are marked.


