
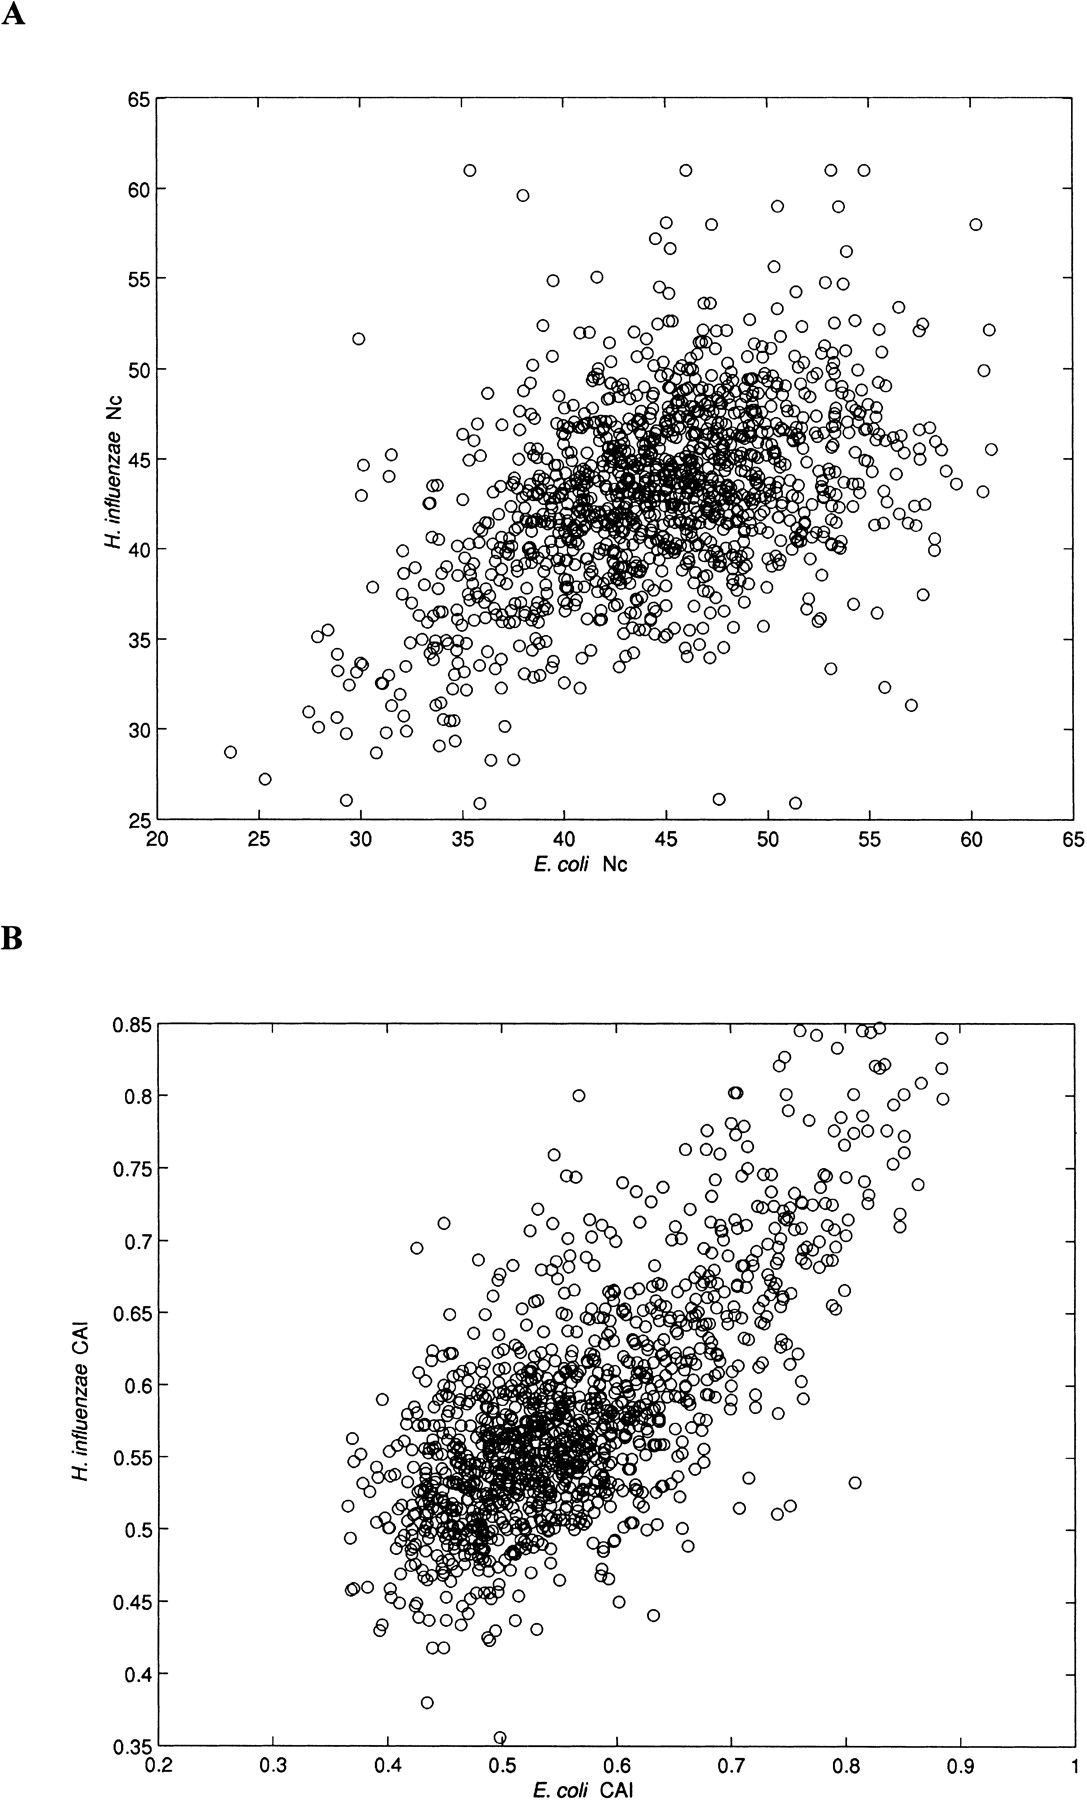
Figure 5
Correlation between codon bias of orthologs. Codon bias is expressed either by Nc values (A) or by CAI values (B). Scatter plots of the corresponding values in 1271 E. coli and H. influenzae orthologs are shown.


