
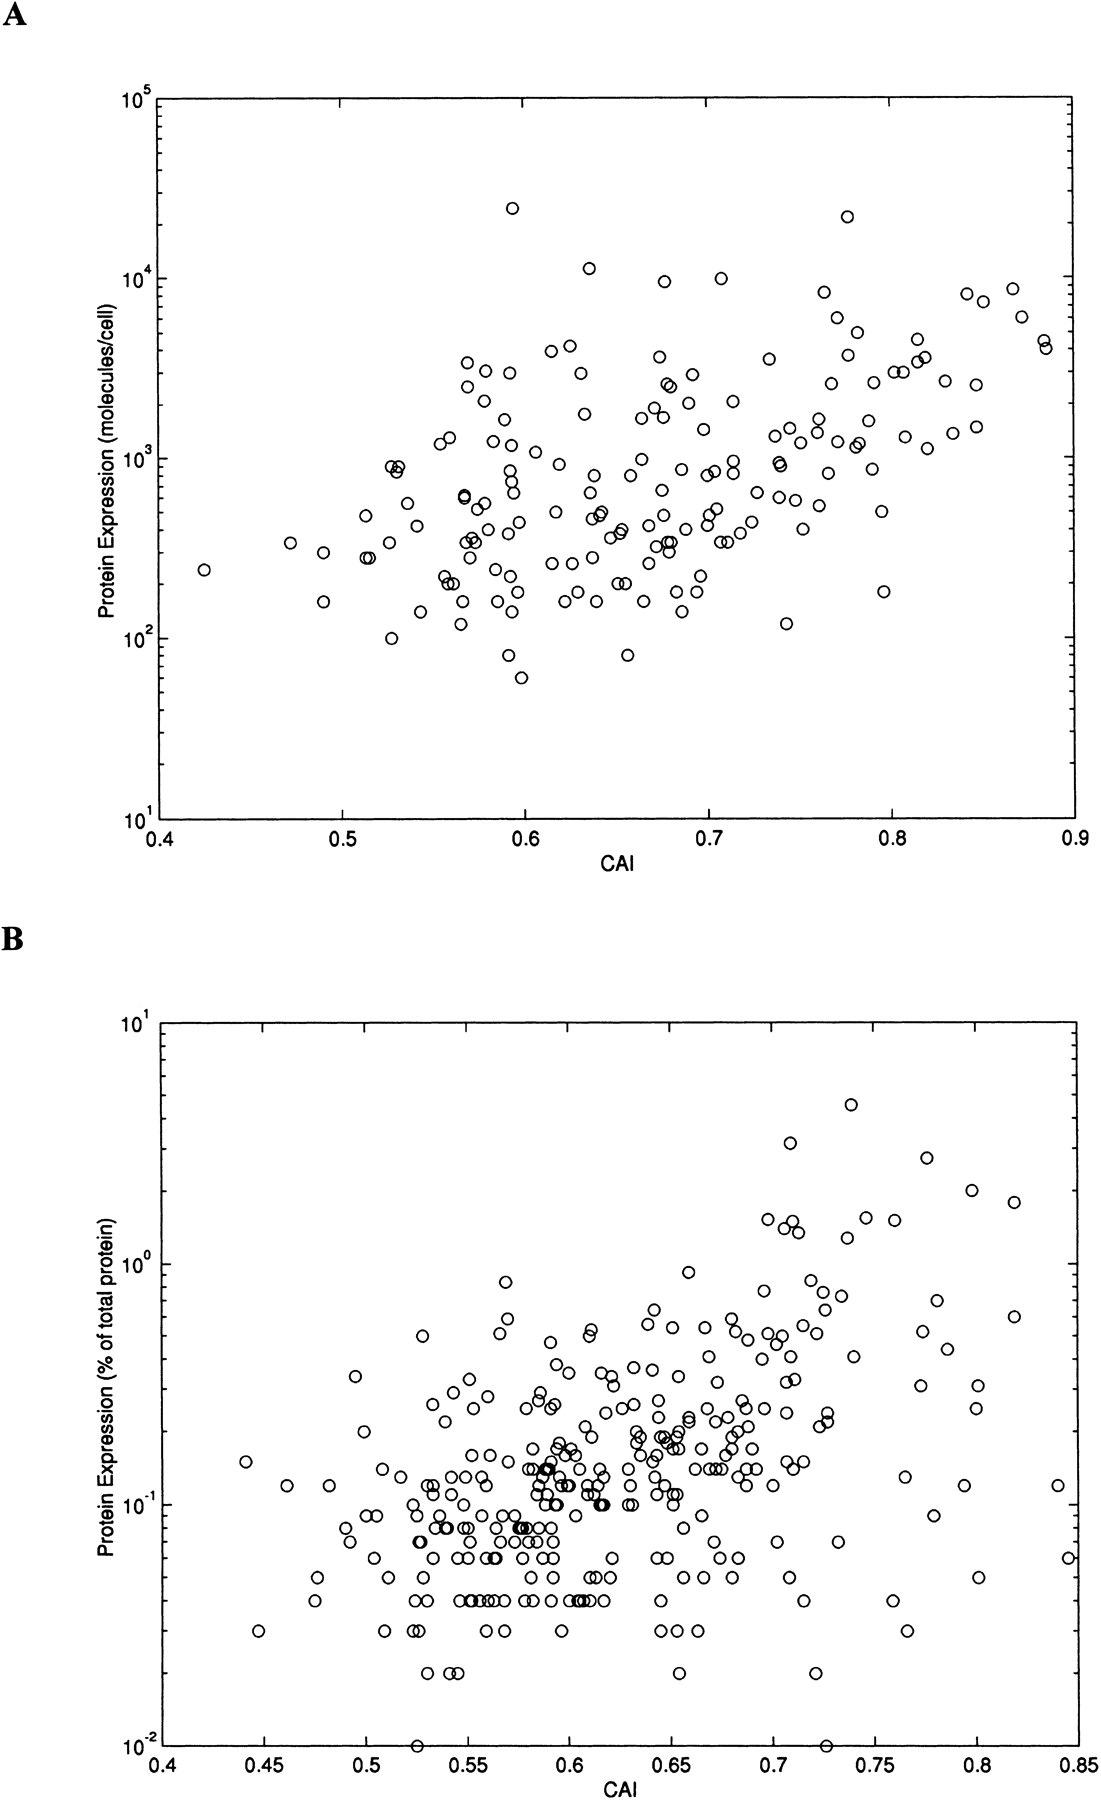
Figure 4
Relationship between codon bias and protein abundance. The bias in codon usage is expressed by the CAI measure. Scatter plots of CAI versus relative protein abundance are shown for 163 highly expressed E. coli proteins (A) and for 297 highly expressed H. influenzae proteins (B). Protein abundance is shown on a log scale.


