
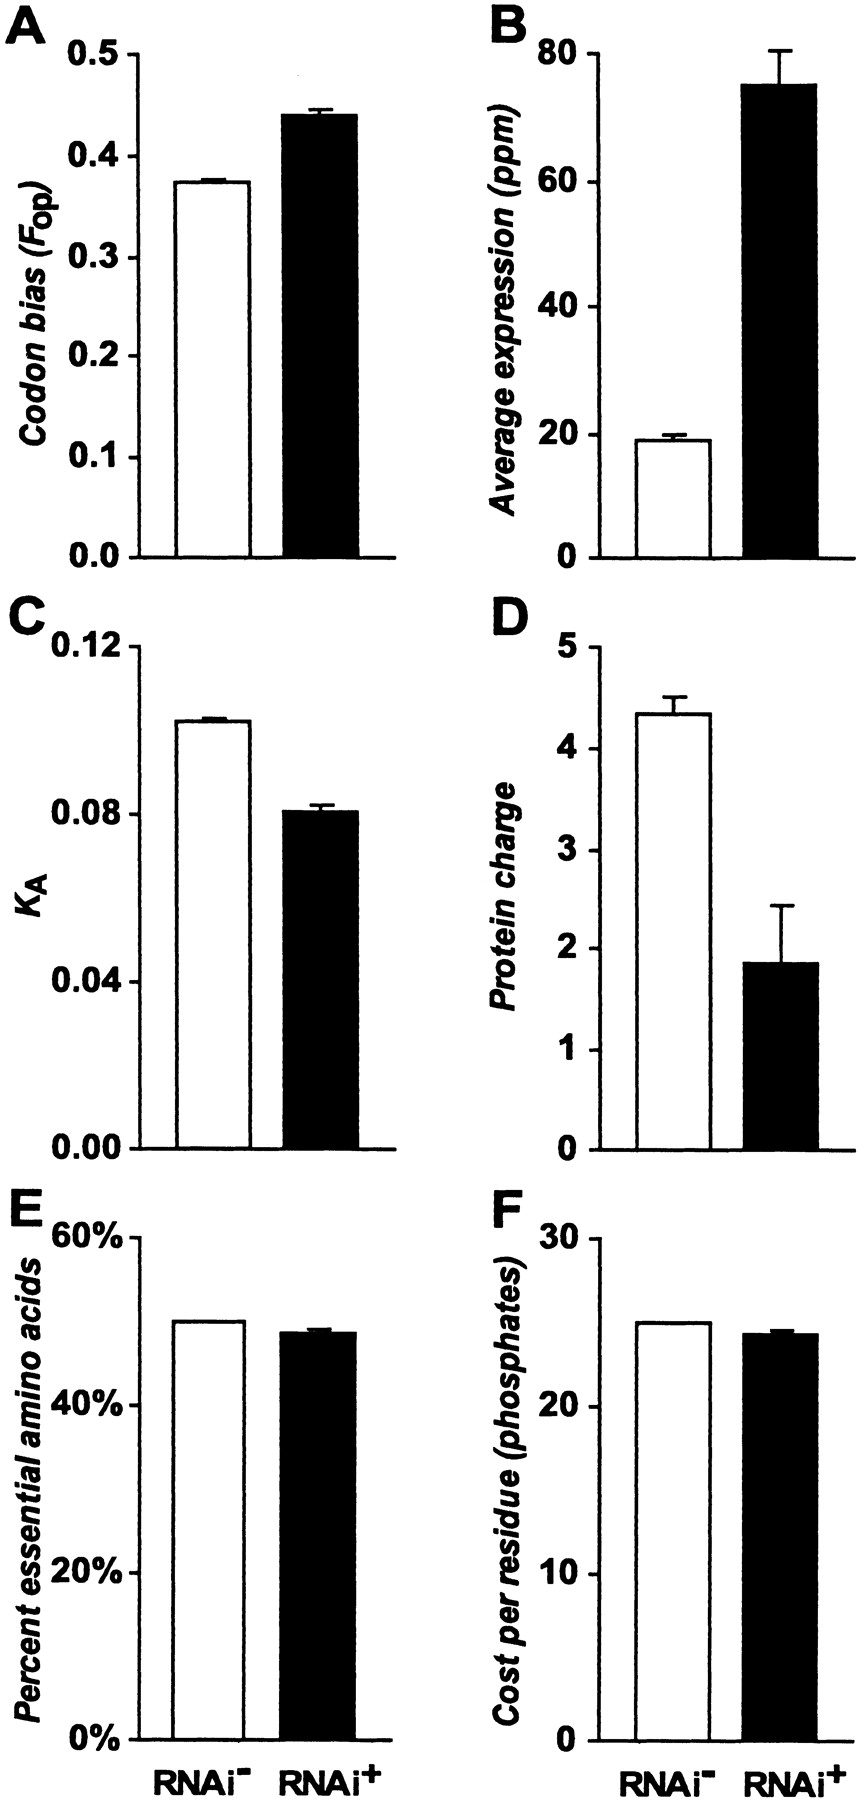
Figure 1
Comparison of features between genes with no observed phenotype (RNAi-) and those with an RNAi phenotype (RNAi+). Codon bias (A), average gene expression (B), rate of nonsynonymous site substitution (C), total protein charge (D), percent essential amino acids (E), and the per-residue cost (number of high-energy phosphate bonds) of proteins (F) each differed significantly between the two phenotype classes in univariate analyses (all P < 0.0001). Error bars, ±1 SE.


