
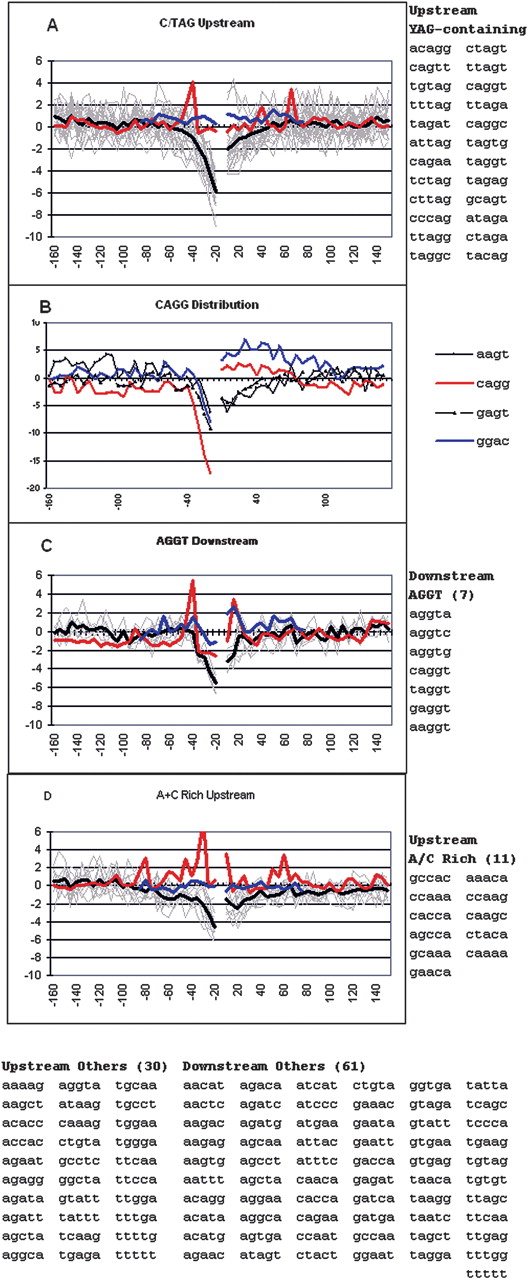
Grouping and distribution of the top negatively scoring flanking pentamers. A subset of 140 pentamers that contributed most with a negative weight to the ability of SVM to distinguish real from pseudo exons were grouped according to their similar positional distributions of their prevalence around exons, as measured by a z-score (see text). Zscores with an absolute value greater than 2 have a P-value of less than 0.05. (A,C,D) Light gray lines represent individual pentamers listed to the right; the heavy dark line is the average. The red line shows the average for the distribution of these pentamers around pseudo exons; the blue line shows this average for repeat-free pseudo exons. Pentamers in each flank were treated separately for extraction from SVM and for clustering. However, their prevalence is shown both upstream and downstream of the exons regardless of their origin. (D) Distribution of the acceptor splice consensus sequence CAGG and related tetramers.


