
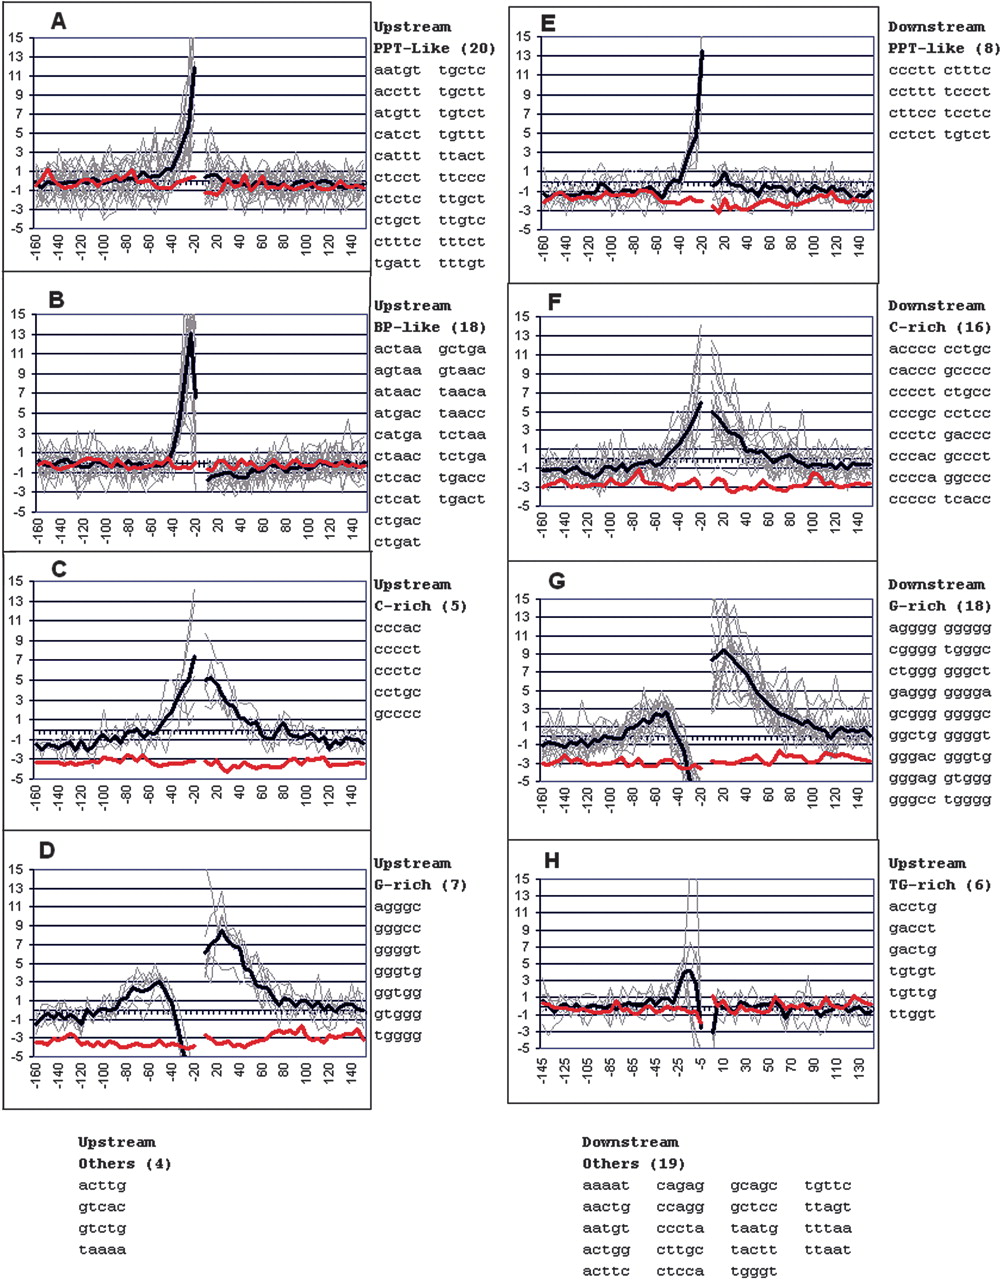
Grouping and distribution of the top positively scoring flanking pentamers. A subset of 121 positively weighted pentamers that contributed most to the ability of SVM to distinguish real from pseudo exons were grouped according to their similar positional distributions of their prevalence around exons, as measured by a z-score (see text). Z-scores with an absolute value greater than 2 have a P-value of less than 0.05. Values were summed for pentamers starting in windows of 5 nt starting just upstream of the acceptor site (-15) and just downstream of the donor site (+7); an exception is panel H, in which upstream windows up to the exon (-1) are shown. Light gray lines represent individual pentamers listed on the right; the heavy dark line is the average. The red line shows the average for the distribution of these pentamers around pseudo exons. Pentamers in each flank were treated separately for extraction from SVM and for clustering. However, their prevalence is shown both upstream and downstream of the exons regardless of their origin.


