
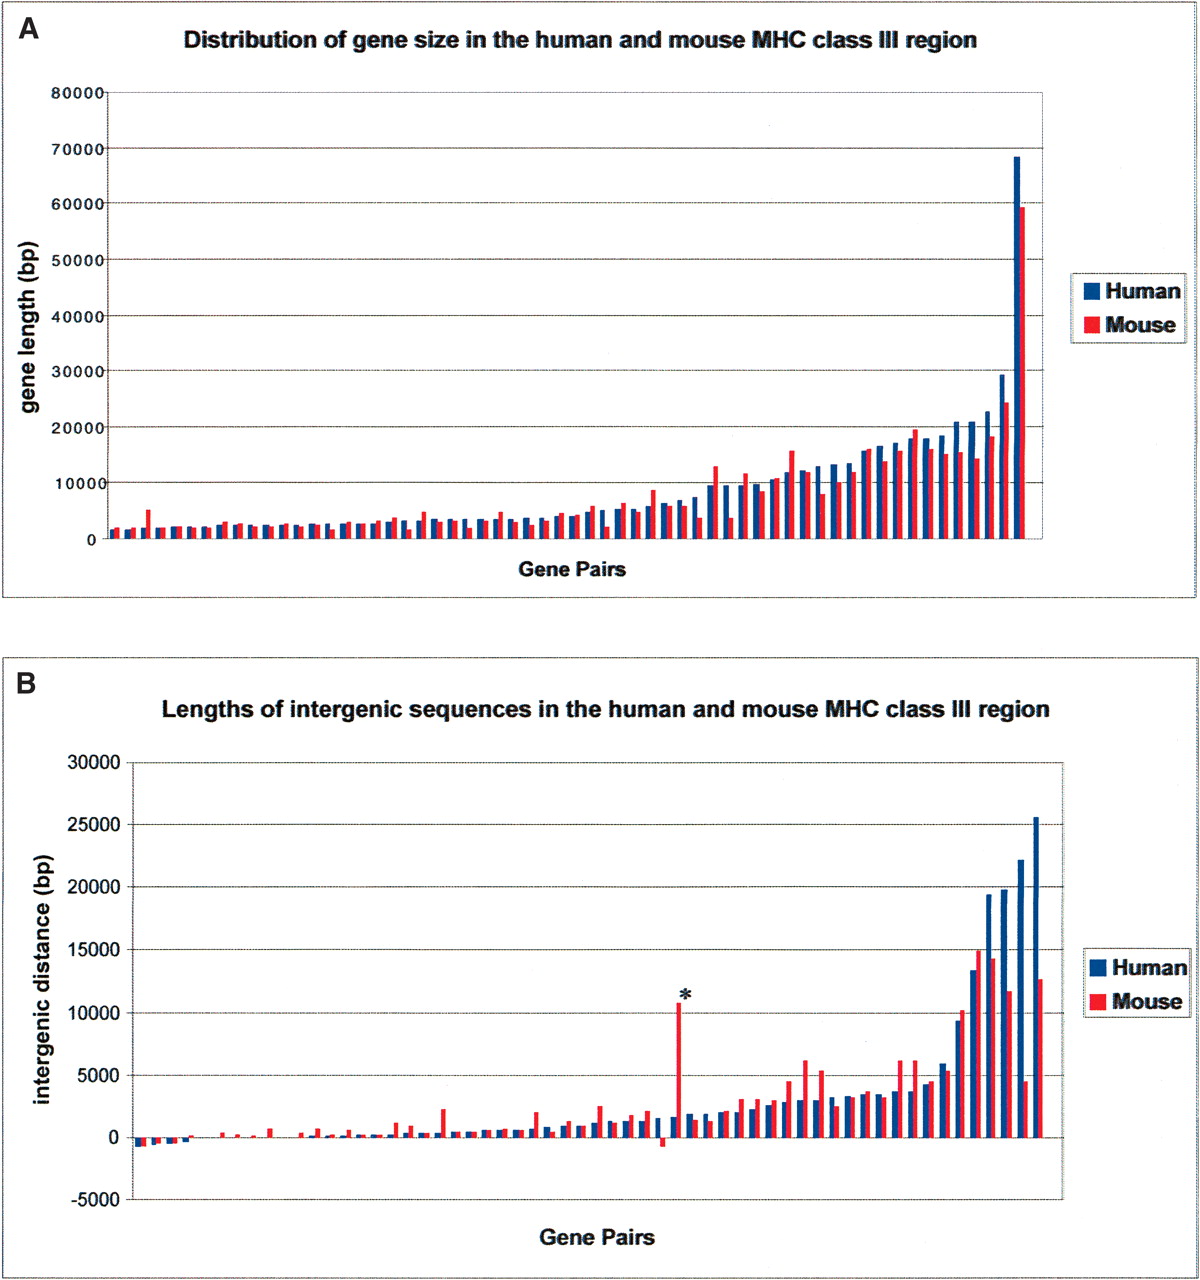
Figure 5
Distribution of gene size (A) and intergenic sequences (B) for the human and mouse MHC class III gene pairs. The X-axis coordinate is the rank order of the human genes. The outlier in B (indicated by *) results from a mouse-specific insertion between the Lsm2 and Vars2 genes, which also harbors the mouse unique gene, G7e. The intergenic distance of mouse Lsm2 to its closest upstream gene, G7e, is 10,829 bp; whereas there are only 1588 bp from the human LSM2 gene to its closest upstream gene, VARS2. Supporting data can be found in Supplemental Table 2.


