
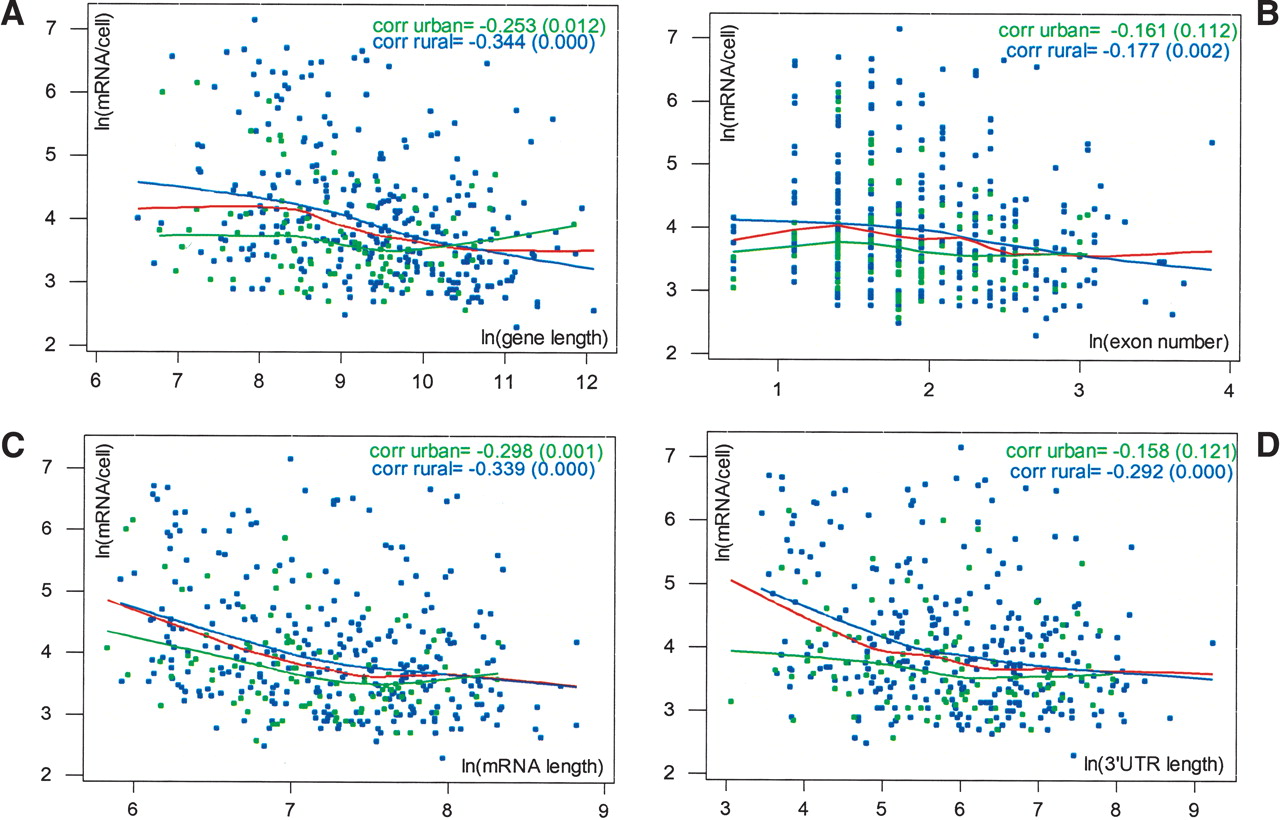
Relationship between expression and morphological parameters within the rural and urban classes. Scatter plots of ln(mRNA/cell) versus ln(gene length), ln(mRNA length) ln(3′-UTR length), and ln(exon number), with lowess smooths for rural and urban classes (blue and green curves), and overall (red curves). Correlations by class are in the upper right corner. The relationships between expression and each of the parameters are considerably weakened for urban genes, indicating that transcriptional interference might be dominant over the other morphological parameters influencing gene expression. (corr) Correlation coefficient. p-values are in parentheses.


