
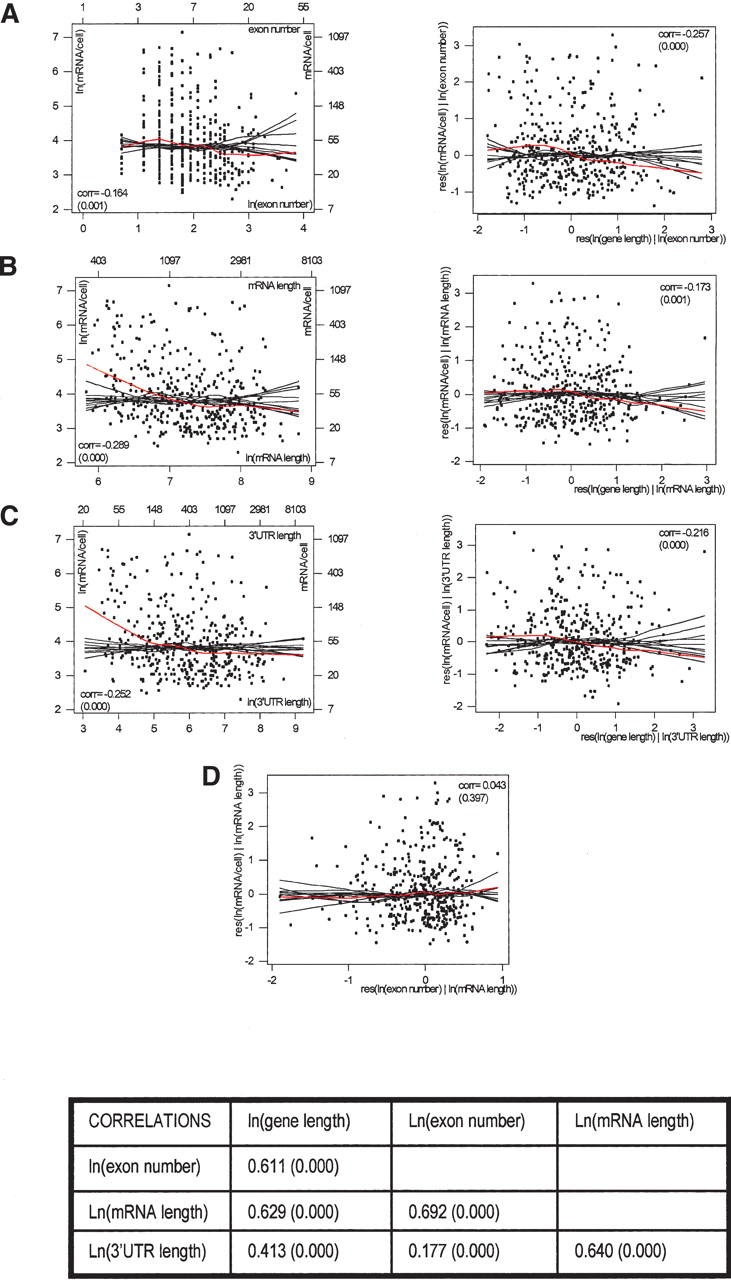
Relationship between expression and morphological parameters. (A-C, left panels) Scatter plots of ln(mRNA/cell) versus ln(exon number), ln(mRNA length), and ln(3′-UTR length), respectively. The red curves represent lowess smooths, and the black curves lowess smooths from random permutations. mRNA expression has strong negative associations with all these parameters. (A-C, right panels) Added variable plots for ln(mRNA/cell) versus ln(gene length) after correcting for ln(exon number), ln(mRNA length), and ln(3′-UTR length), respectively. Red and black curves are again lowess smooths on original data and random permutations; (res) residual. All three of these parameters account for a substantial portion of the negative association between expression and gene length, but leave a substantial remainder effect, lending support to a role of transcriptional elongation. The table at the bottom of the figure contains correlations between parameters. Because of the very high positive correlation between exon number and mRNA length, the effects of splicing and mRNA stability and their contributions to the effect of gene length, although individually observable, are confounded. This is shown by panel D, which contains the added variable plots for ln(mRNA/cell) versus ln(exon number), after correcting for ln(mRNA length). (corr) Correlation coefficient. p-values are in parentheses.


