
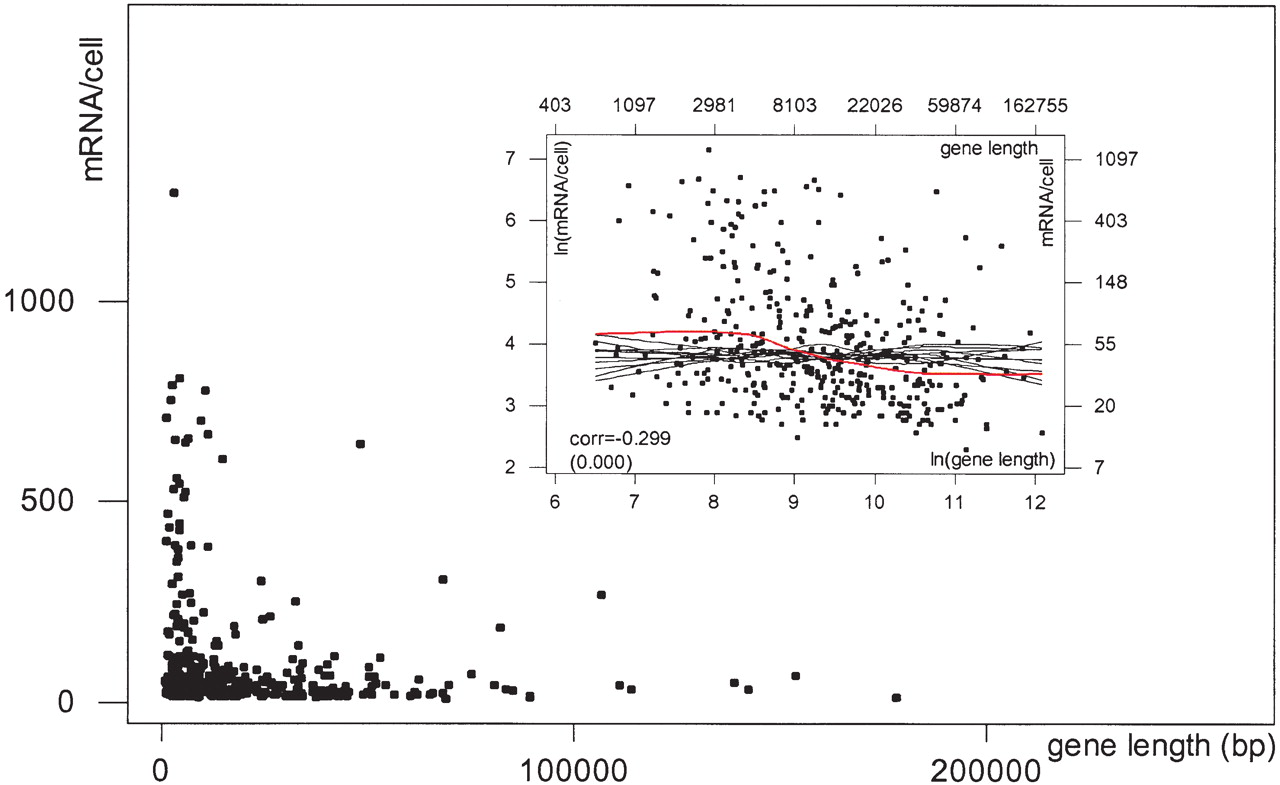
Figure 2
Dependence of expression on gene length. Expression (mRNA/cell) of 393 genes in the MHKT plotted against gene length. (Inset) Natural log scatter plot of the same data. The logarithmic transformation regularizes the data and helps in visualizing dependence patterns. Axes on top and on the right provide readings before logarithmic transformation of the numbers. The red curve represents a lowess smooth of the data, and the black curves lowess smooths from random permutations. Both plots reveal a strong negative association between expression and gene length. (corr) Correlation coefficient. p-values are in parentheses.


