
Figure 1
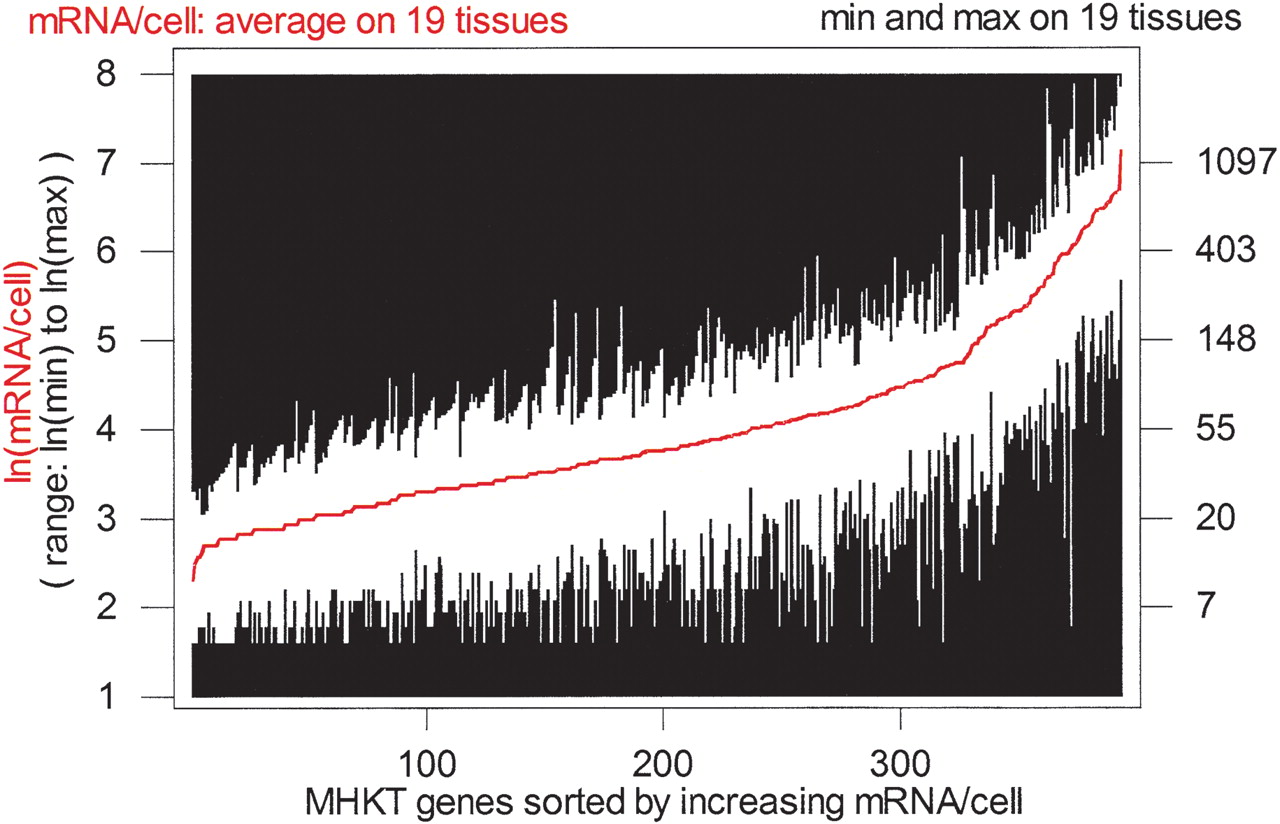
Range of expression of the genes of the MHKT. Average (red curve) and min-to-max range (white bars) of expression for the 393 genes of the MHKT in 19 tissues (from Velculescu et al. 1999).
(Downloading may take up to 30 seconds. If the slide opens in your browser, select File -> Save As to save it.)
Click on image to view larger version.
Range of expression of the genes of the MHKT. Average (red curve) and min-to-max range (white bars) of expression for the 393 genes of the MHKT in 19 tissues (from Velculescu et al. 1999).
 CiteULike
 Delicious
 Digg
Digg Facebook
 Google+
 Reddit
 Twitter
