
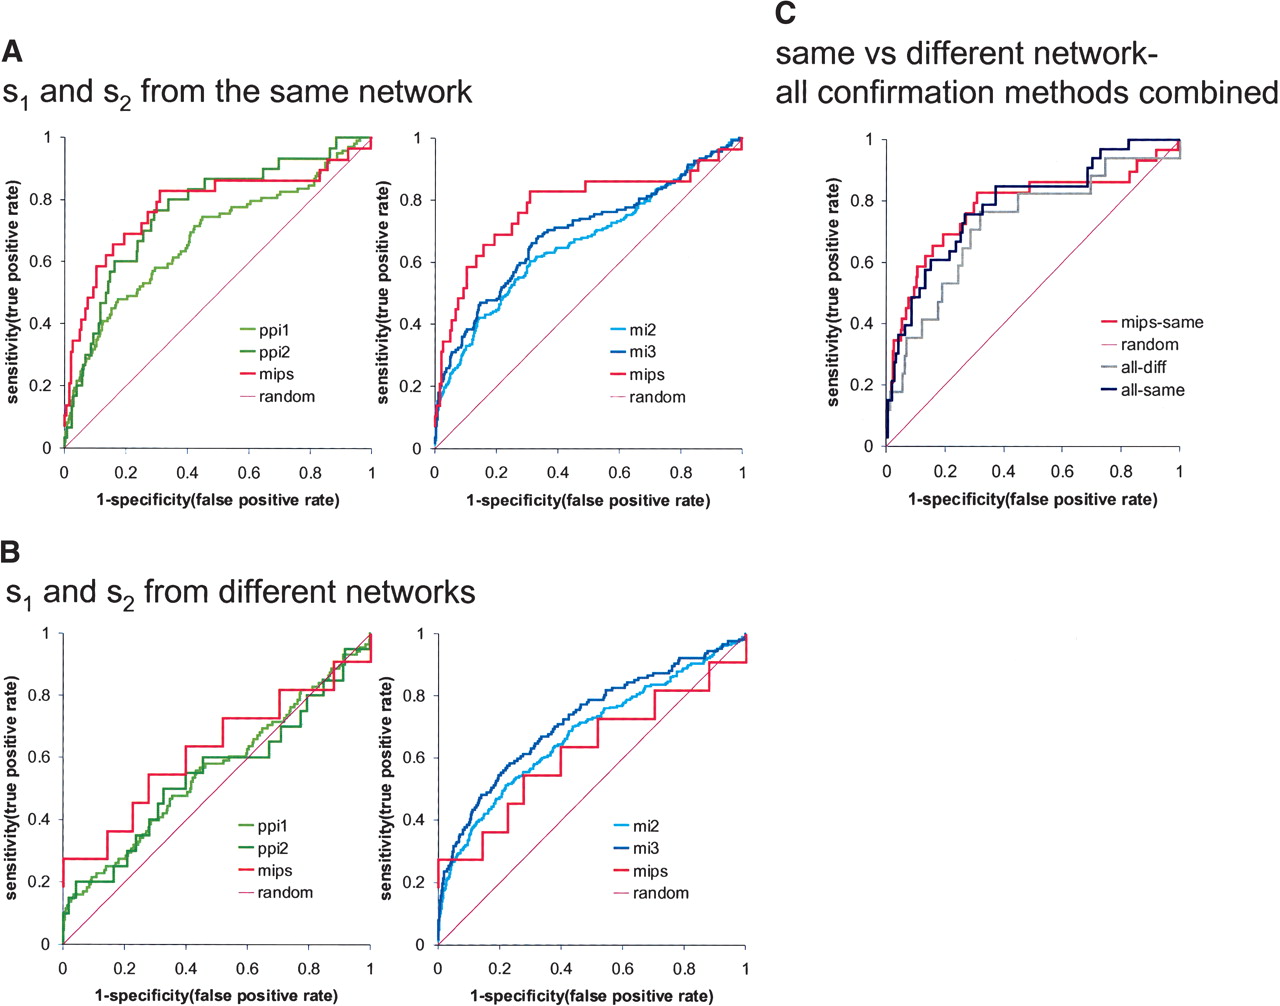
Figure 3
ROC plots of true-positive rate (sensitivity) vs. false-positive rate (1 - specificity) for the prediction of protein–protein interaction (ppi1, ppi2), protein complexes (mips), and“co-citation” (mi2, mi3). The source genes s1, s2 are chosen from same (A) or different networks (B). (C) An ROC plot using the union of ppi2, mips, and mi3 as verification network, with source genes s1, s2 chosen from the same network (all-same) or different networks (all-diff).


