
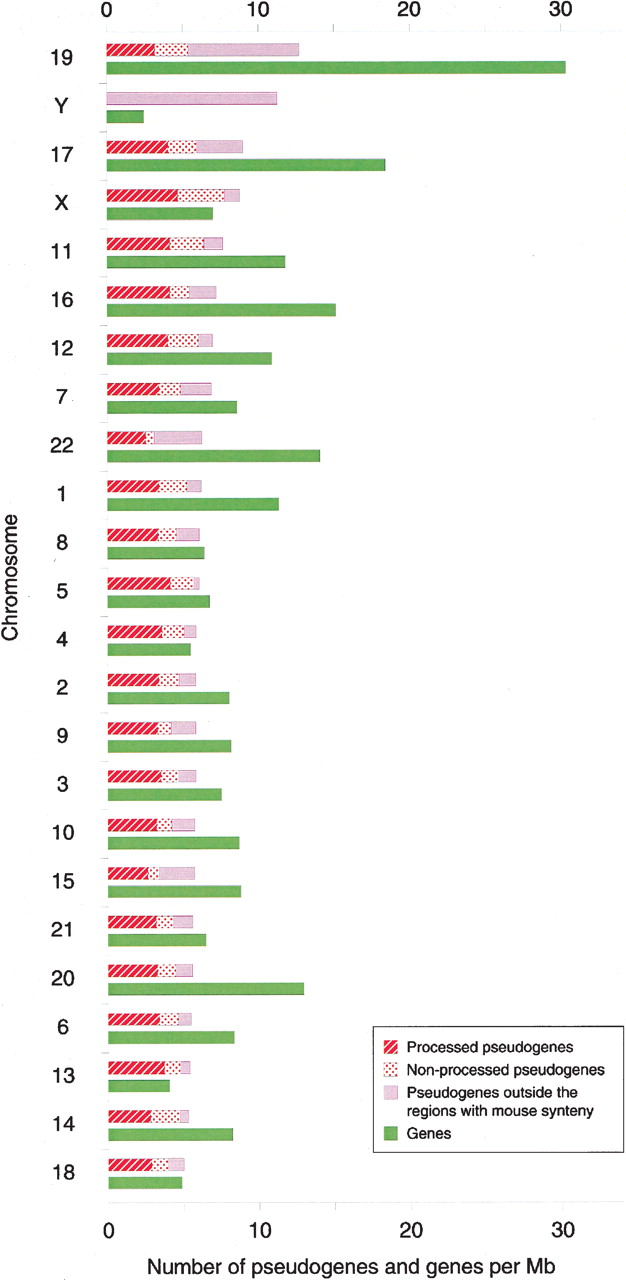
Figure 3
Distribution of genes and the different types of pseudogenes for each of the human chromosomes. We have displayed for each human chromosome the number of pseudogenes (separated in different types; see chart legend for details) and genes per megabase. Chromosomes have been ordered according to the density of pseudogenes (highest on top).


