
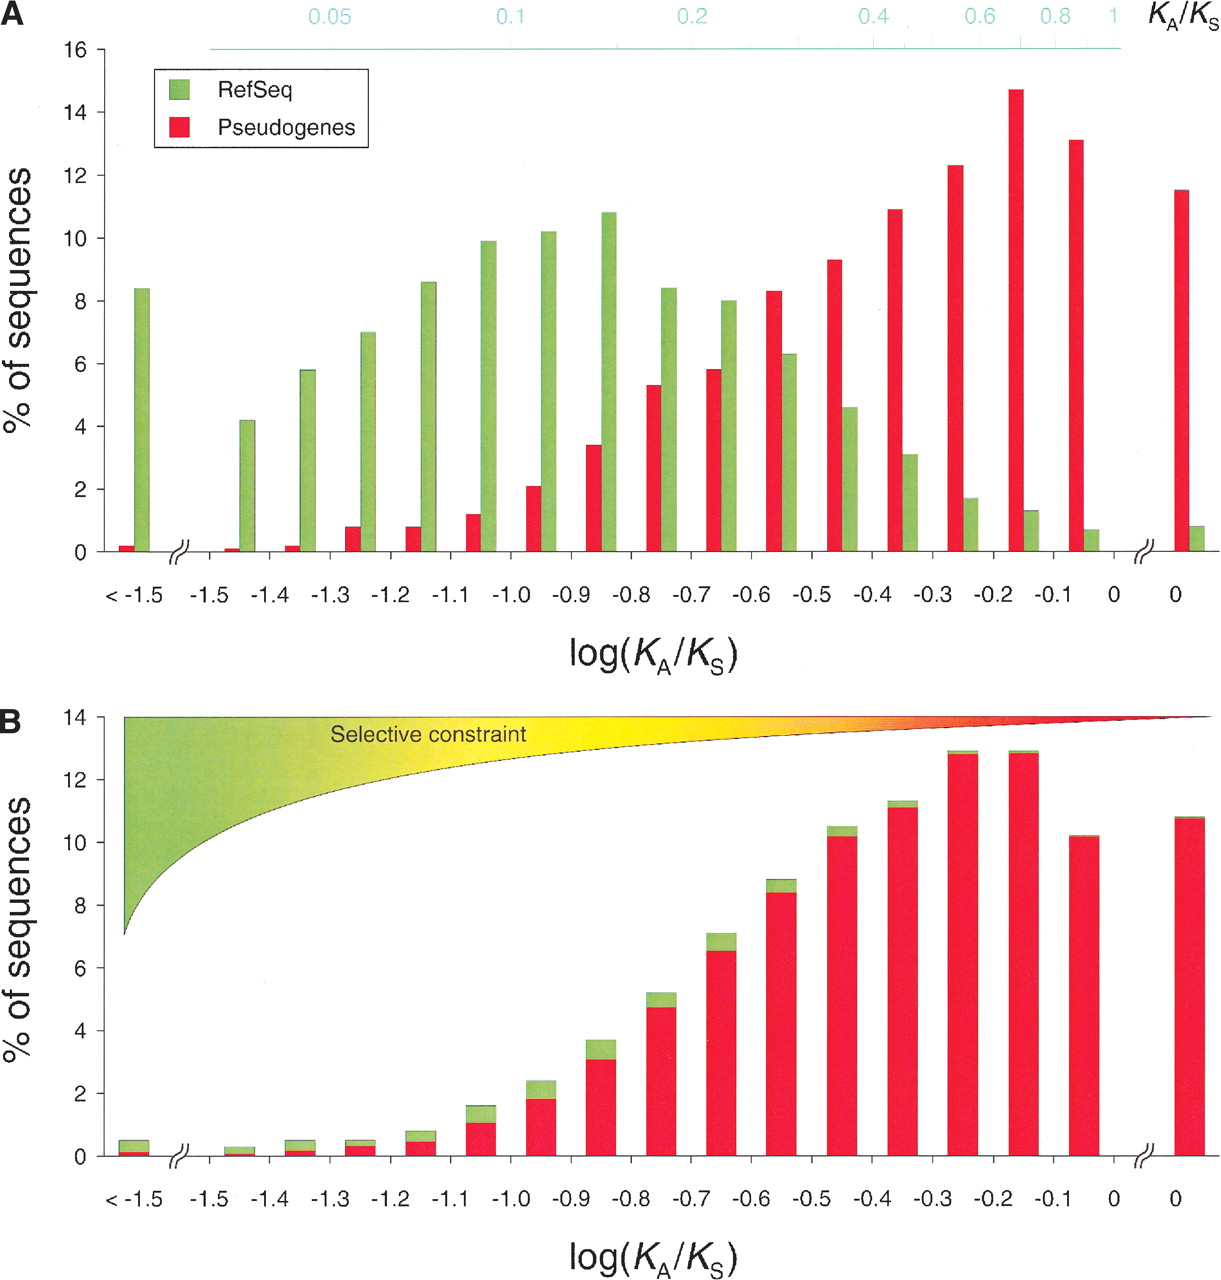
KA/KS distributions of benchmark and candidate sets. The KA/KS distributions (as log KA/KS) associated with the functional (green) and pseudogenic (red) benchmark sets (A) as well as the test sequence set (B) are shown. An average of 40% of the sequences analyzed in this study satisfied our requirements for the KA/KS calculation. The subsets of sequences with KA/KS values (1659 for the functional, 1703 for the pseudogenic benchmark sets, and 3291 for the test set) are expected to be representative for each of the corresponding complete sets, as what determines whether a KA/KS value can be calculated for a sequence (availability of homologous sequences and restrictions on the KA/KS calculation; see Methods) is likely to equally affect genes and pseudogenes. By using the least-squares fitting against the benchmark distributions, we evaluated the fraction of pseudogenic (red) and functional (green) sequences for each of the bins of the test distribution and combined them to determine that up to 95% of the sequences analyzed correspond to pseudogenes.


