
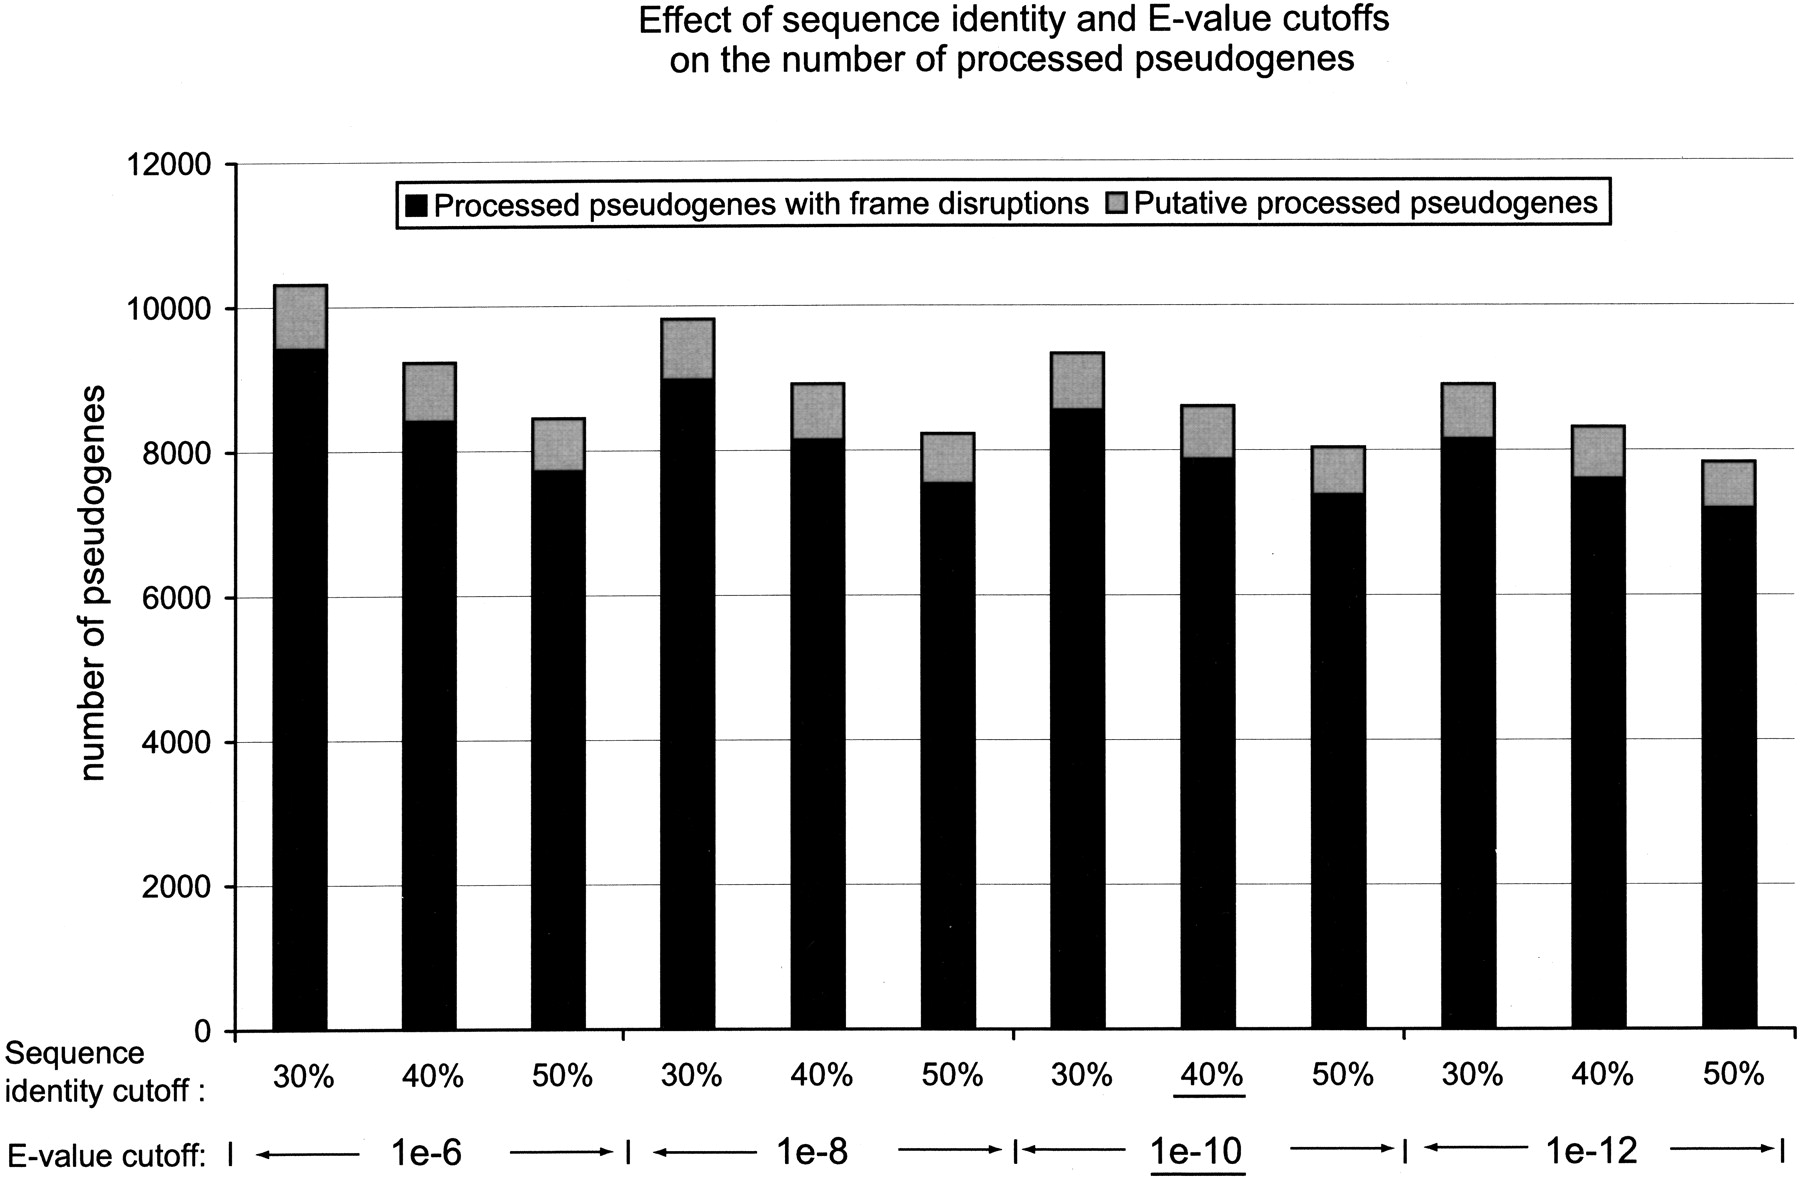
Figure 8
Effects of sequence identity and BLAST E-value cutoffs. For different combinations of sequence identity and BLAST E-value, the total numbers of processed pseudogenes and “putative” processed pseudogenes in the final sets are shown together. The cutoffs that were used in this study are underlined.


