

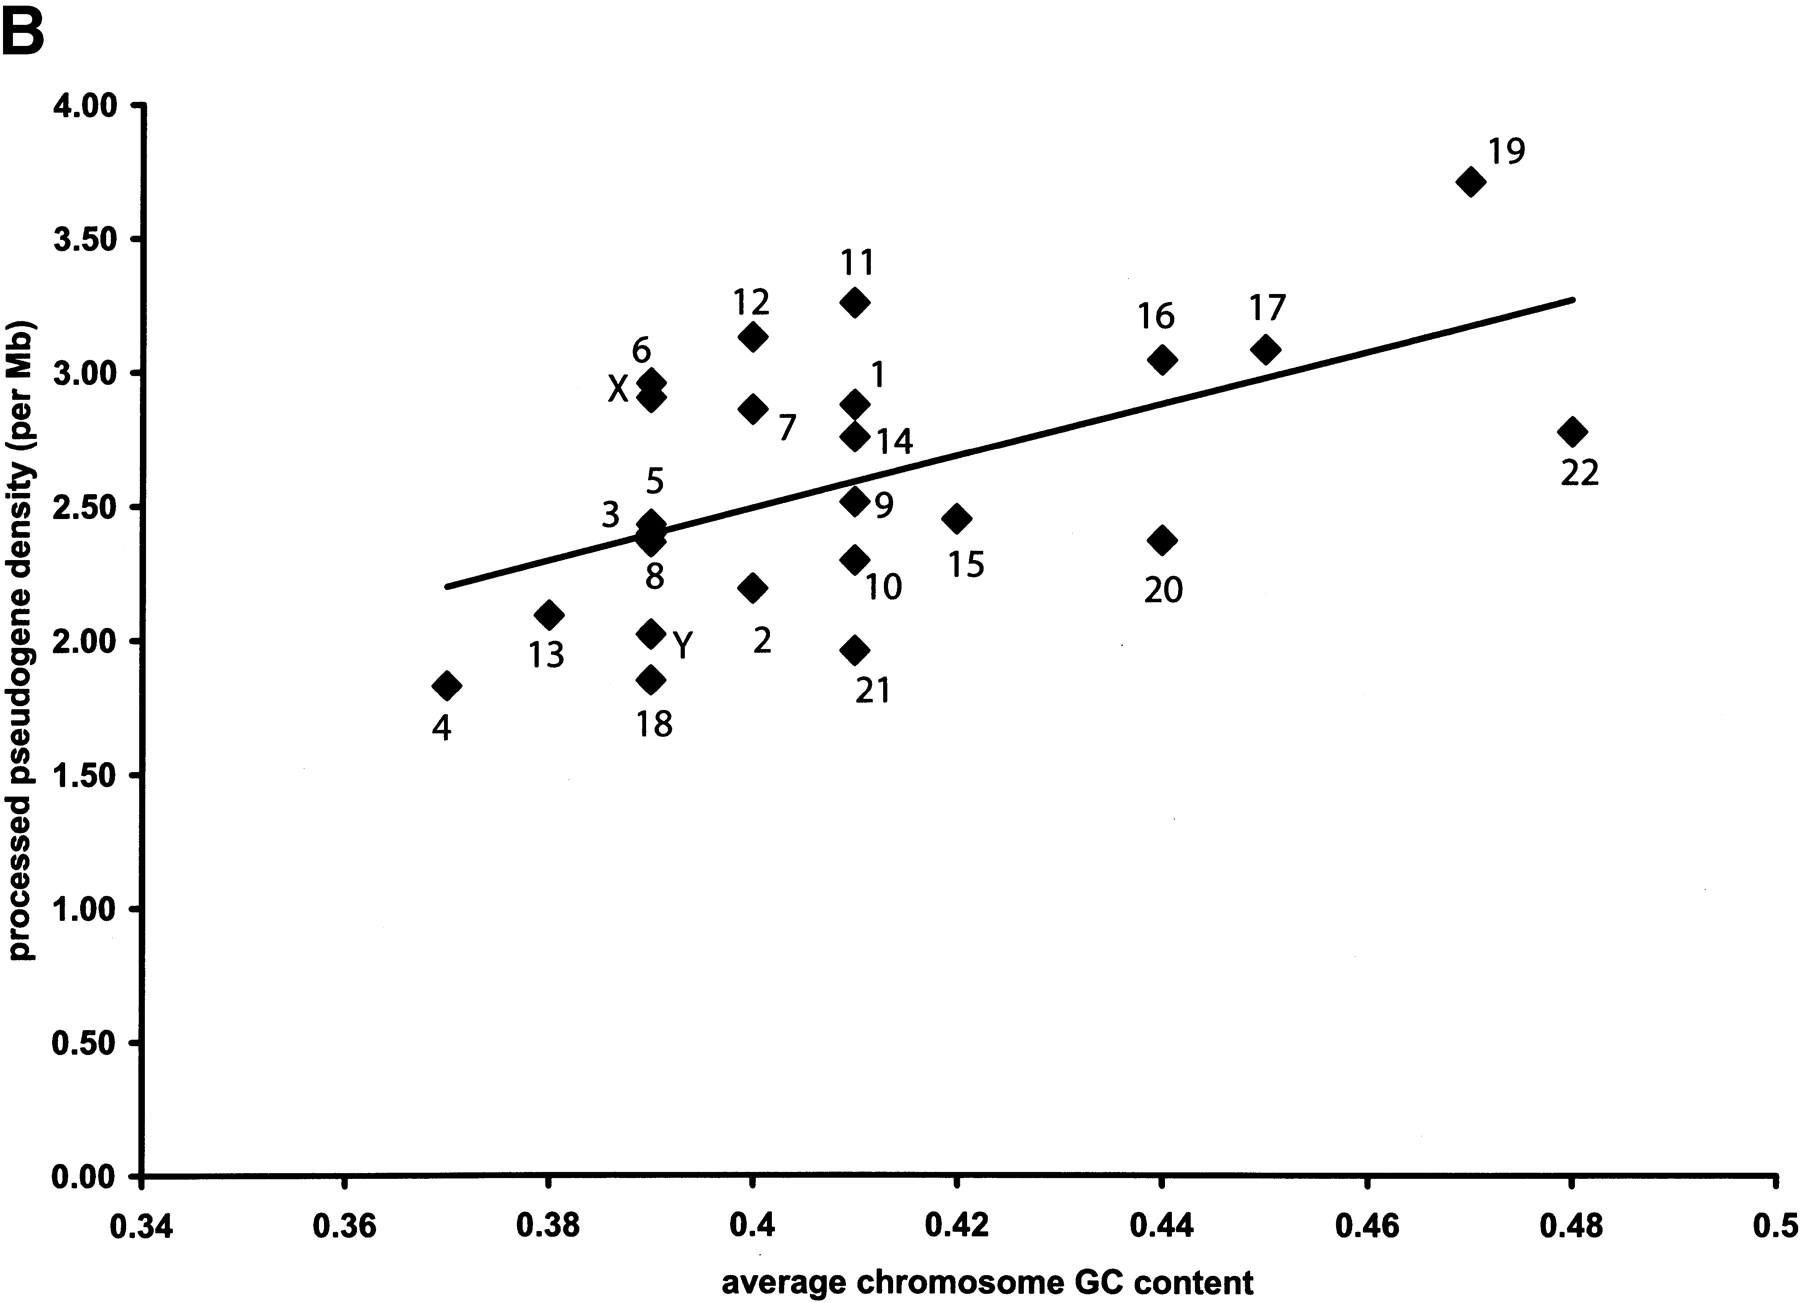
Figure 2
Distribution of human processed pseudogenes among chromosomes. Each filled diamond ♦ represents a chromosome. (A) Correlation between chromosome length and number of processed pseudogenes on each chromosome (R = 0.92, P < 10-10). (B) The processed pseudogene density on each chromosome is correlated with the chromosome GC content (R = 0.55, P < 10-2).


