
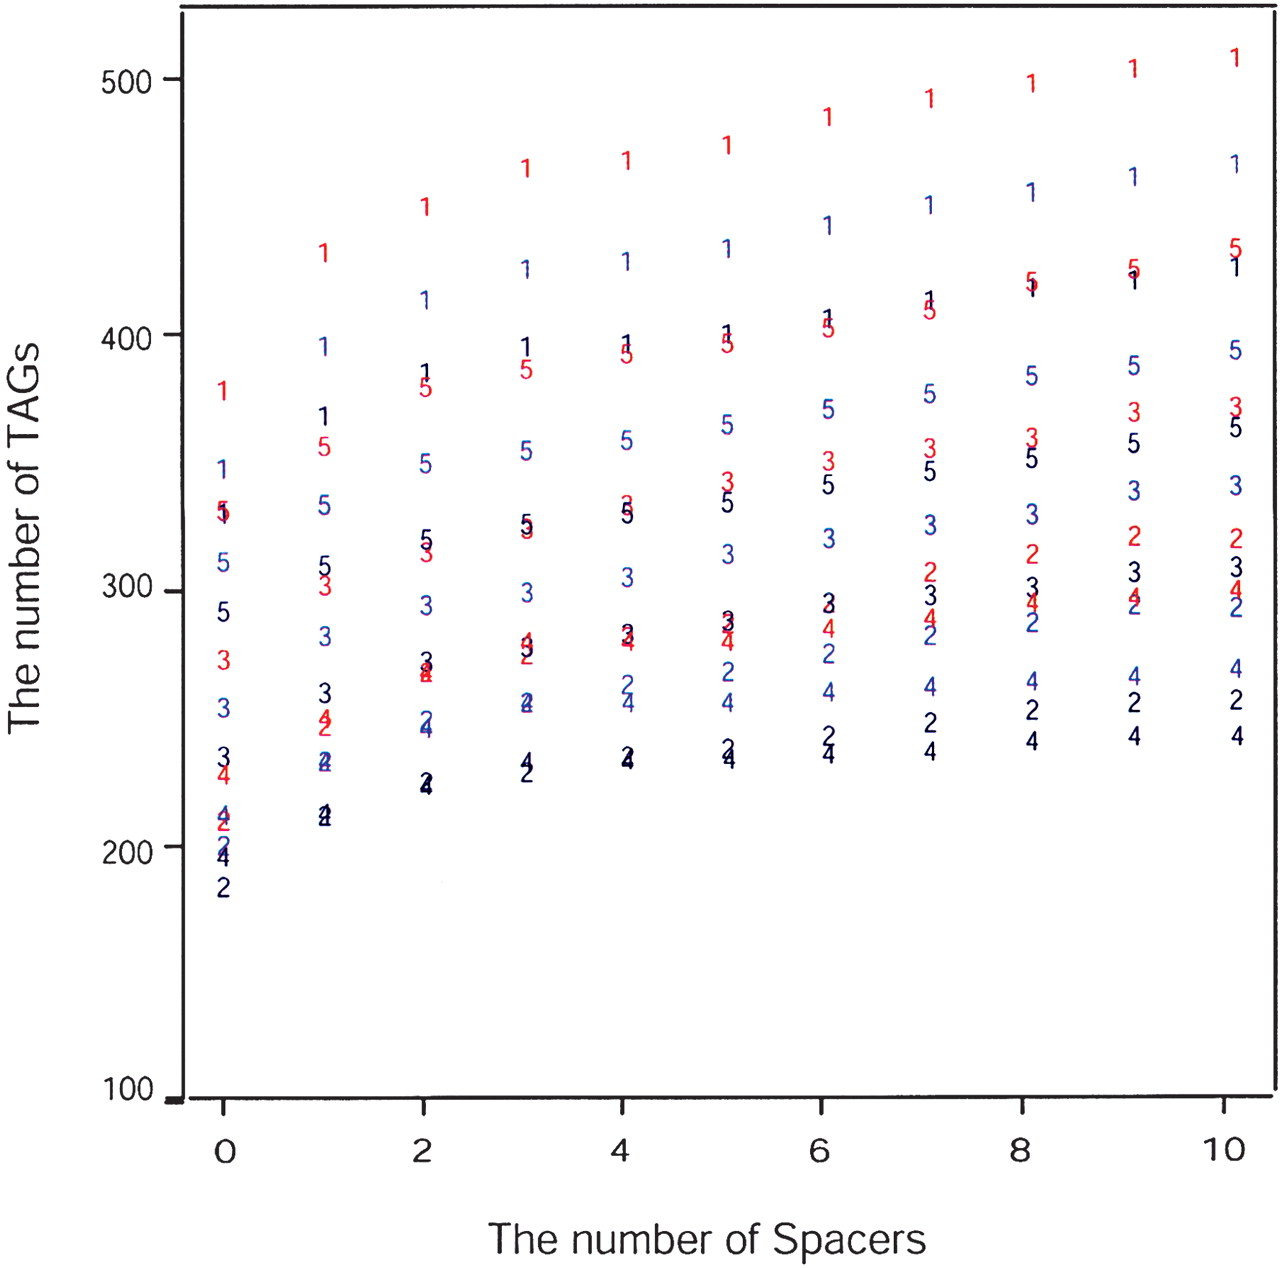
Figure 3
The number of TAGs as a function of spacers and E-values. The numbers represent the chromosomes. For each chromosome, red numbers represent TAGs identified with an E-value 10-10, blue numbers represent TAGs identified with an E-value of 10-20, and black numbers represent TAGs identified with an E-value of 10-30.


