
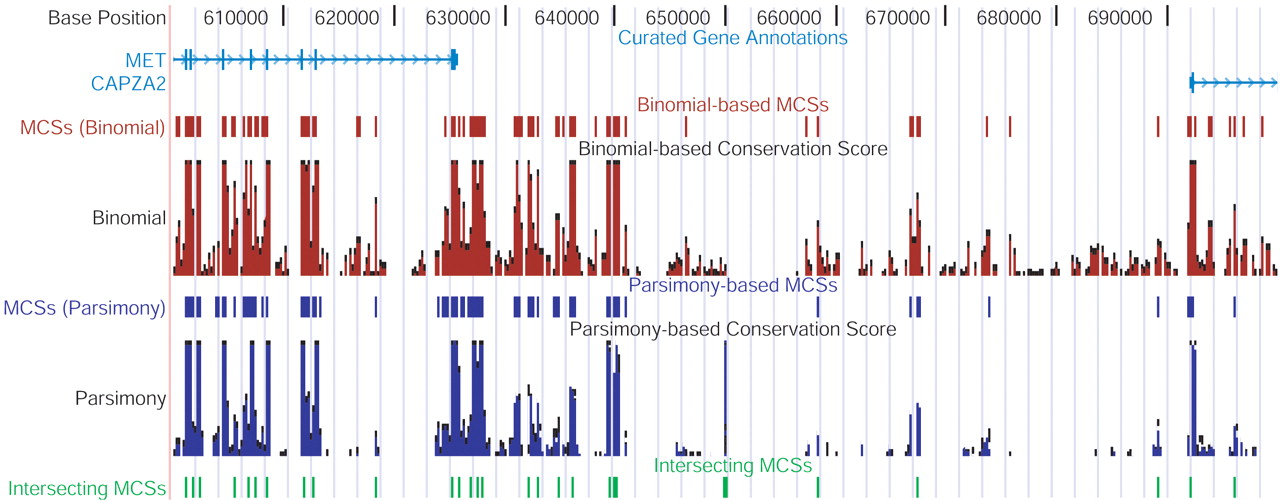
Positions of MCSs relative to other annotated genomic features. A complete representation of the positions of MCSs within the ∼1.8-Mb targeted region is available at a customized version of the UCSC Genome Browser (see http://genome.ucsc.edu). A view depicting a ∼100-kb interval encompassing the intergenic region between MET and CAPZA2 is shown. The thick vertical boxes in the “Curated Gene Annotations” track correspond to exons. The positions of MCSs identified by the binomial- (red) and parsimony- (purple) based methods are shown in separate tracks, as are the underlying conservation scores calculated by each method (depicted as bar graphs). Also shown are the positions of the intersecting set of MCSs (green; see text and Fig. 2).


