
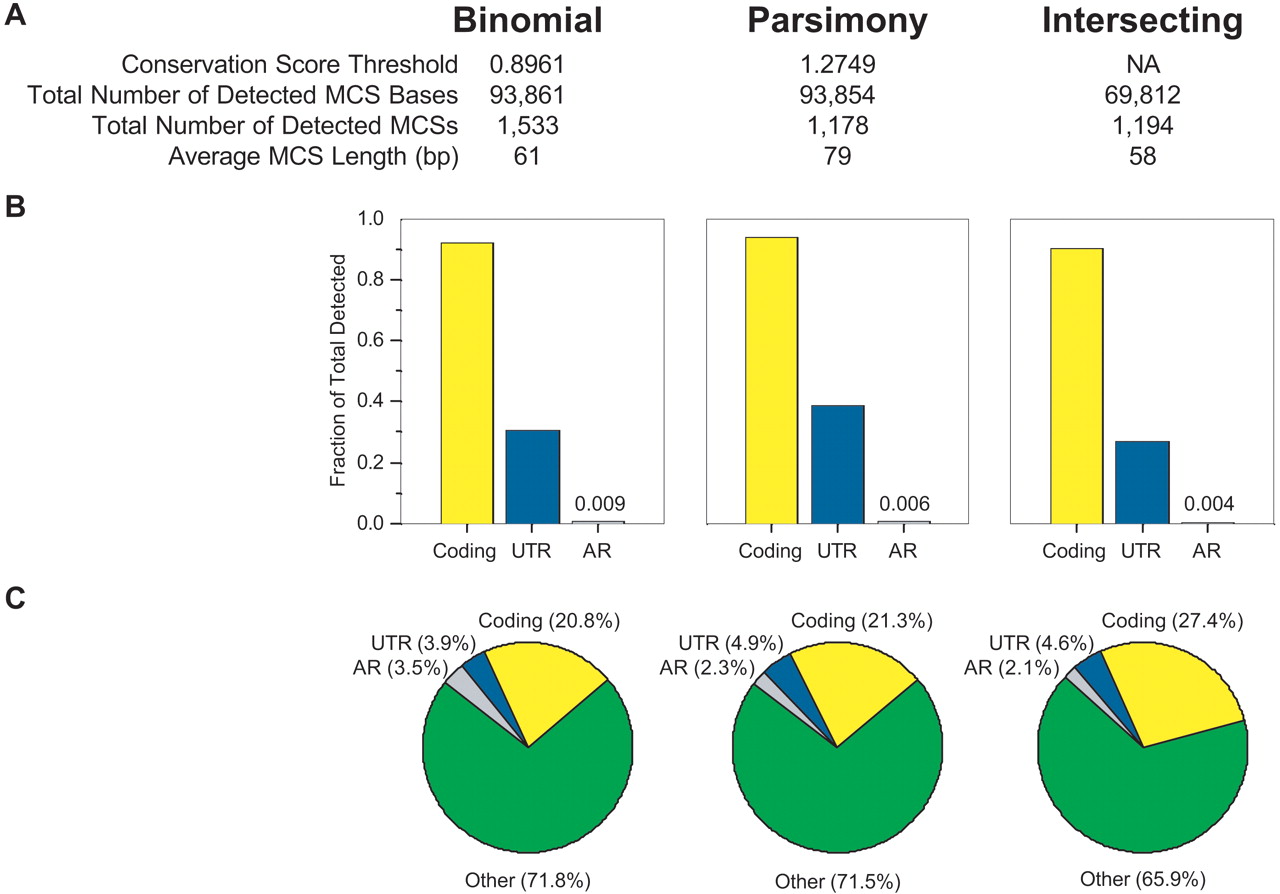
Characteristics of MCSs detected by different methods. The “Binomial” and “Parsimony” columns provide a summary of the MCSs generated by each respective method. The “Intersecting” column provides a summary of the MCSs derived by intersecting the results of the binomial- and parsimony-based methods (see Methods and Fig. 4). The general features of the detected MCSs are provided in A. The thresholds used for the binomial- and parsimony-based methods result in a virtually identical number of MCS bases; however, the total number of detected MCSs (and correspondingly their average length) varied between the two methods. Also, the greater number of intersecting MCSs compared to those detected by the parsimony-based method reflects the fact that some MCSs were fragmented by the intersection process. The bar graphs in B depict the fraction of coding, UTR, and AR bases in the target region that overlaps the indicated set of MCSs. For the fraction of AR bases, the exact values are also provided. The pie charts in C depict the percentage of MCS bases that corresponds to coding (yellow), UTR (blue), AR (grey), and other (green) sequence.


