
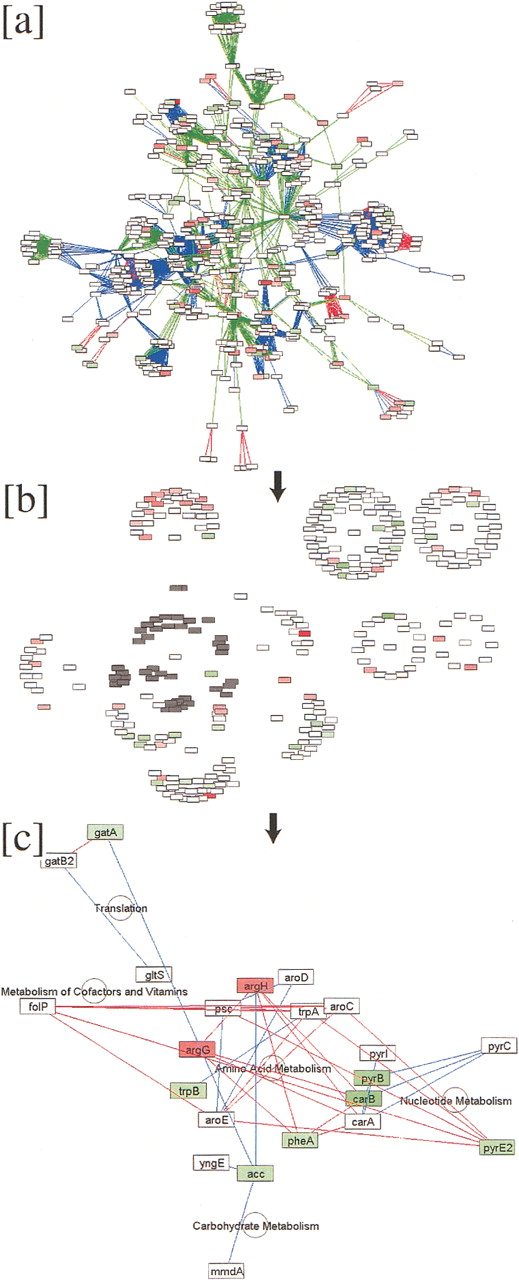
Function-guided layout of the Halobacterium inferred protein network facilitates simultaneous exploration of large discrete databases. (a) The largest connected component of the Halobacterium network is shown; red, green, and blue edges indicate phylogenetic interactions, protein-protein interactions inferred from yeast, and domain-fusion events, respectively (see text). Node colors indicate mRNA expression changes in a phototrophy deficient strain relative to the parent, in which red is induced and green is repressed. (b) Attribute-based layout was used to organize the network according to major functional classes. The cluster predominantly involved with amino-acid metabolism is selected for further exploration (shaded nodes), with edges hidden for clarity. (c) A highly connected subnetwork within the amino-acid metabolism cluster reveals the effect of suppression of phototrophy on amino-acid metabolismand highlights interactions with nucleotide metabolism and other pathways.


