
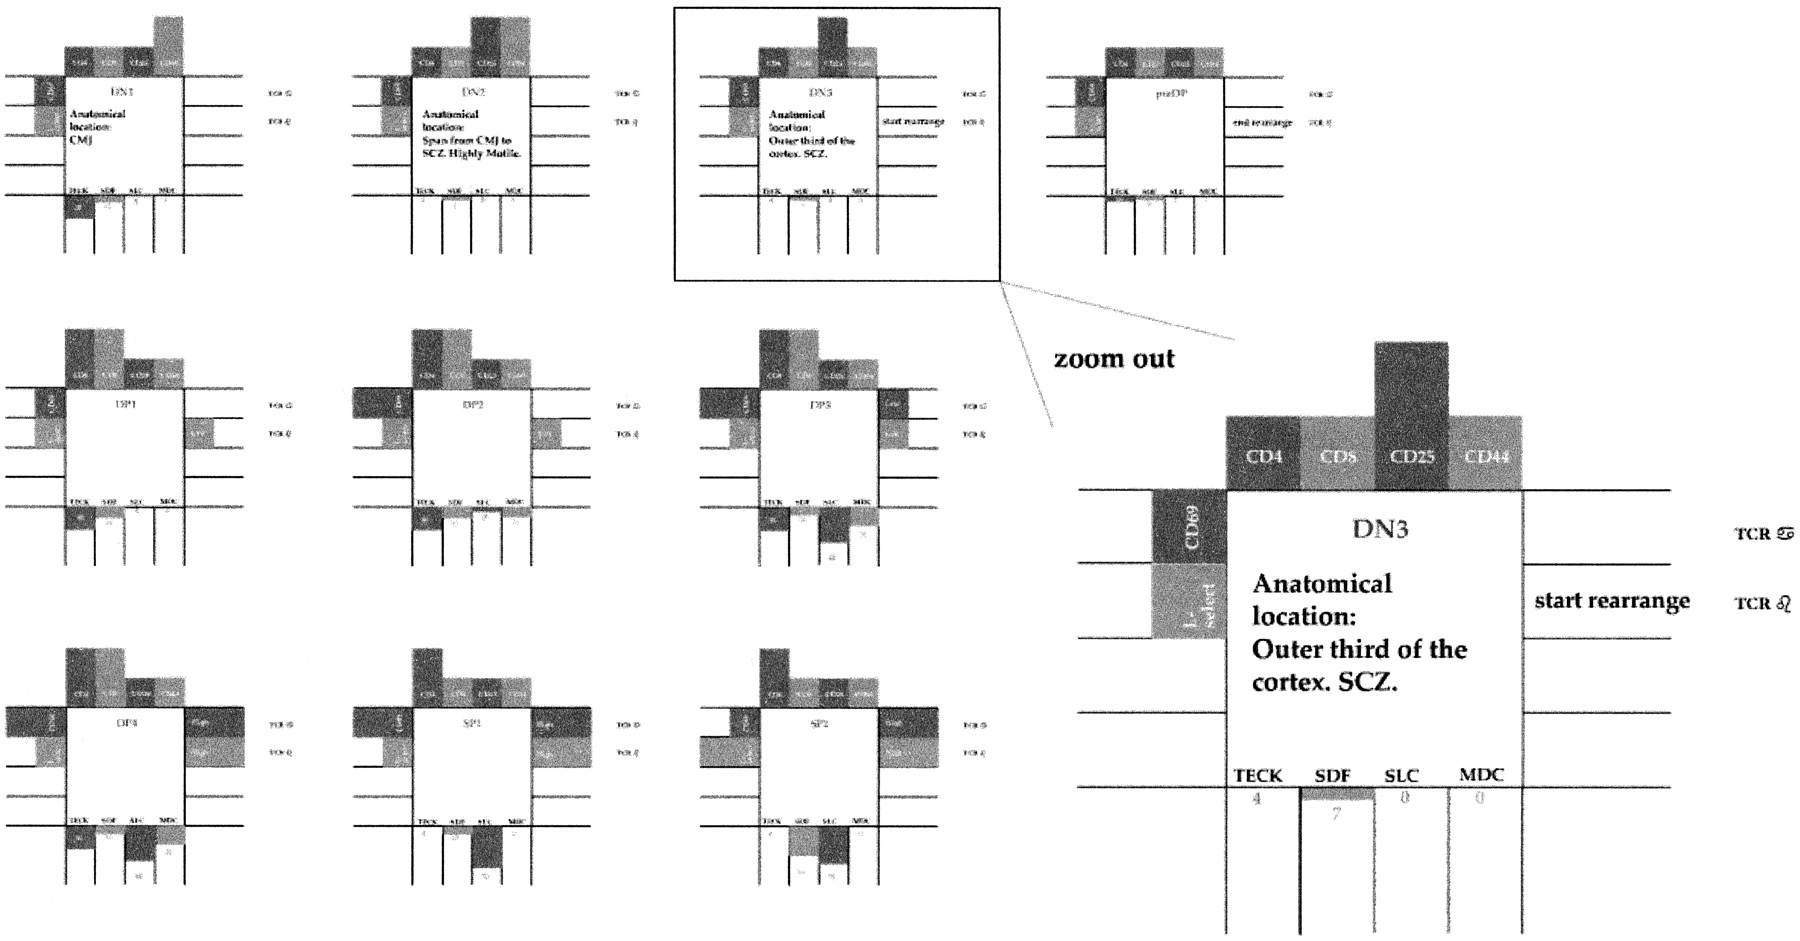
Figure 7
A visual representation of the developmental stages thymocytes go through. The representation also shows, together with conventional markers, the migratory abilities of each developmental stage. During run-time, the user may click on an animated thymocyte to retrieve the representation shown in the figure, with the appropriate stage highlighted. Further, each of the marked receptors and molecules serves as a button. A click on this button retrieves the scientific paper that is the source for the inclusion of the receptor, molecule, or any scientific detail.


