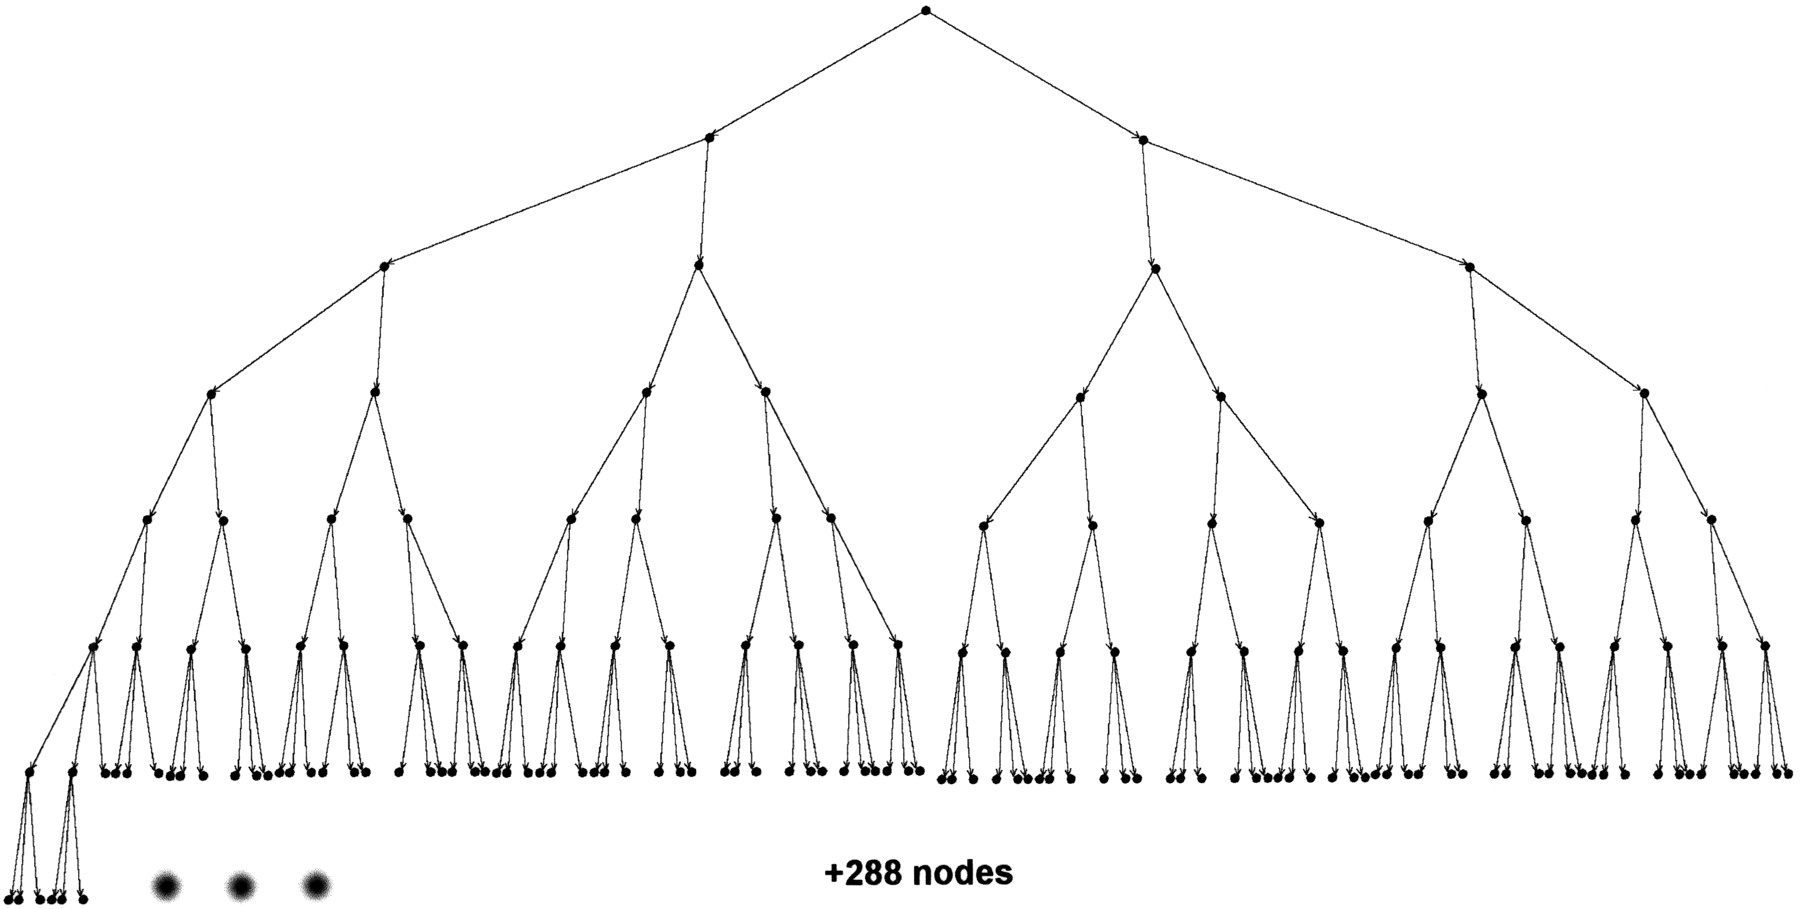
Toward Rigorous Comprehension of Biological Complexity: Modeling, Execution, and Visualization of Thymic T-Cell Maturation

(Downloading may take up to 30 seconds. If the slide opens in your browser, select File -> Save As to save it.)

Click on image to view larger version.

Figure 2
Figure 2

The 288 final nodes represent the final decisions of a thymocyte regarding which chemokine it may respond to. (The graph representing the tree was built with the DiGraph drawing algorithm described in Carmel et al. (2002).

This Article

  1. Genome Res. 13: 2485-2497

Preprint Server