
Figure 1
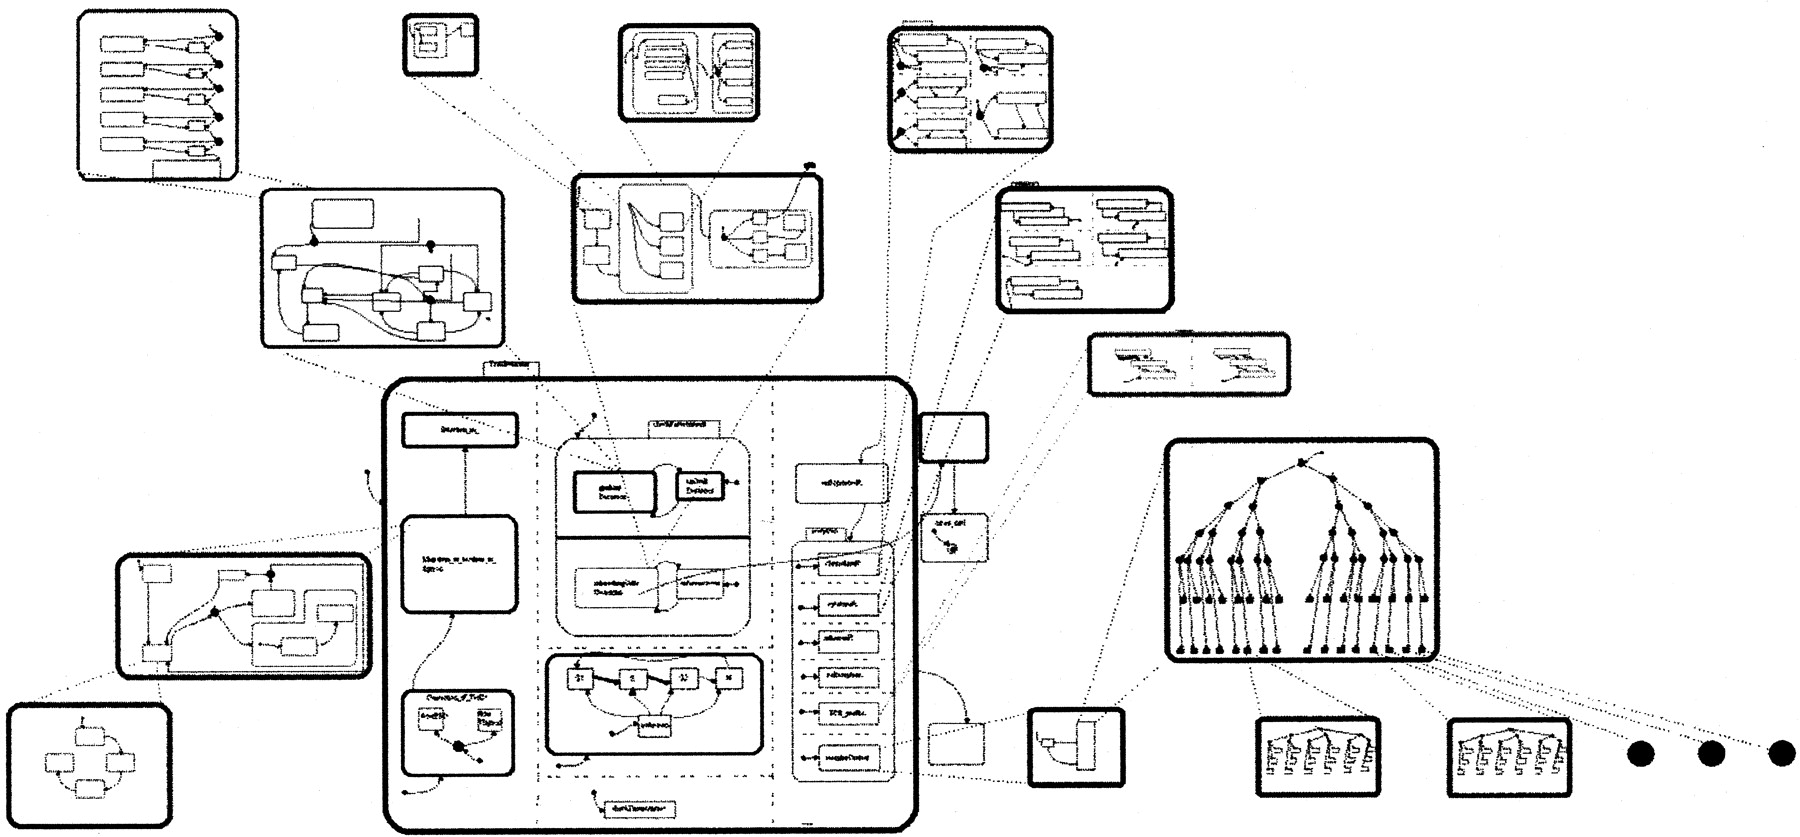
A pseudo statechart of a thymocyte. The three-dimensional representation is our way of representing statecharts from different levels and showing their interrelationships.
(Downloading may take up to 30 seconds. If the slide opens in your browser, select File -> Save As to save it.)
Click on image to view larger version.
A pseudo statechart of a thymocyte. The three-dimensional representation is our way of representing statecharts from different levels and showing their interrelationships.
 CiteULike
 Delicious
 Digg
Digg Facebook
 Google+
 Reddit
 Twitter
