
Figure 8
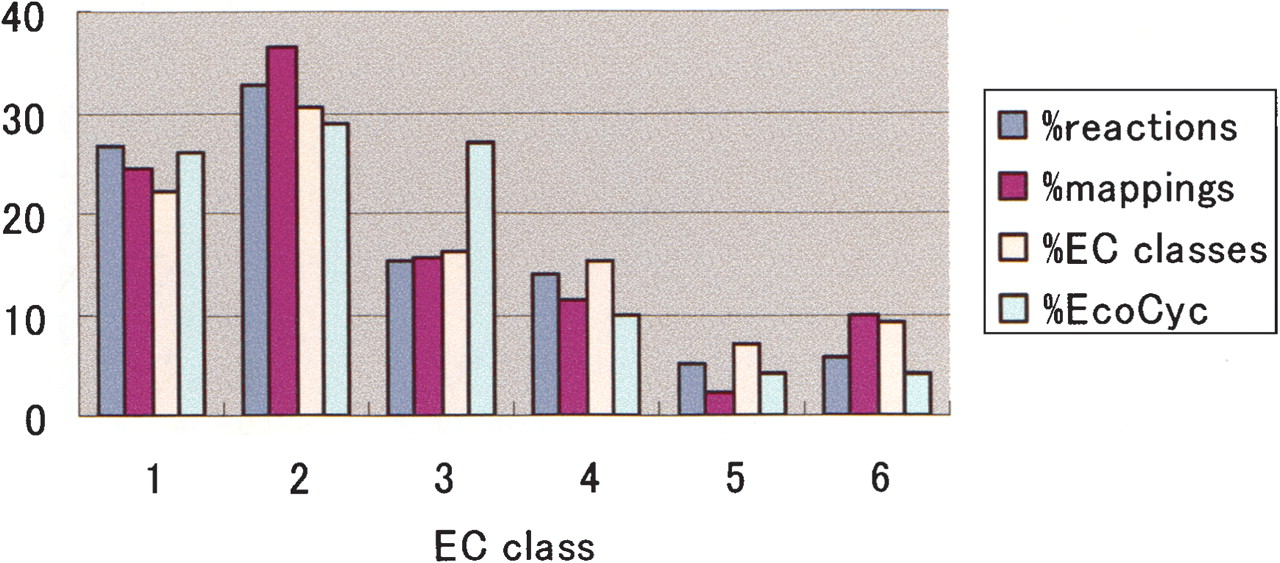
The number of reactions, mappings, and EC sub-subclasses in the E. coli metabolism against the total number of EC sub-subclasses in the EcoCyc database. Colors conform to those in Fig. 7.
(Downloading may take up to 30 seconds. If the slide opens in your browser, select File -> Save As to save it.)
Click on image to view larger version.
The number of reactions, mappings, and EC sub-subclasses in the E. coli metabolism against the total number of EC sub-subclasses in the EcoCyc database. Colors conform to those in Fig. 7.
 CiteULike
 Delicious
 Digg
Digg Facebook
 Google+
 Reddit
 Twitter
