
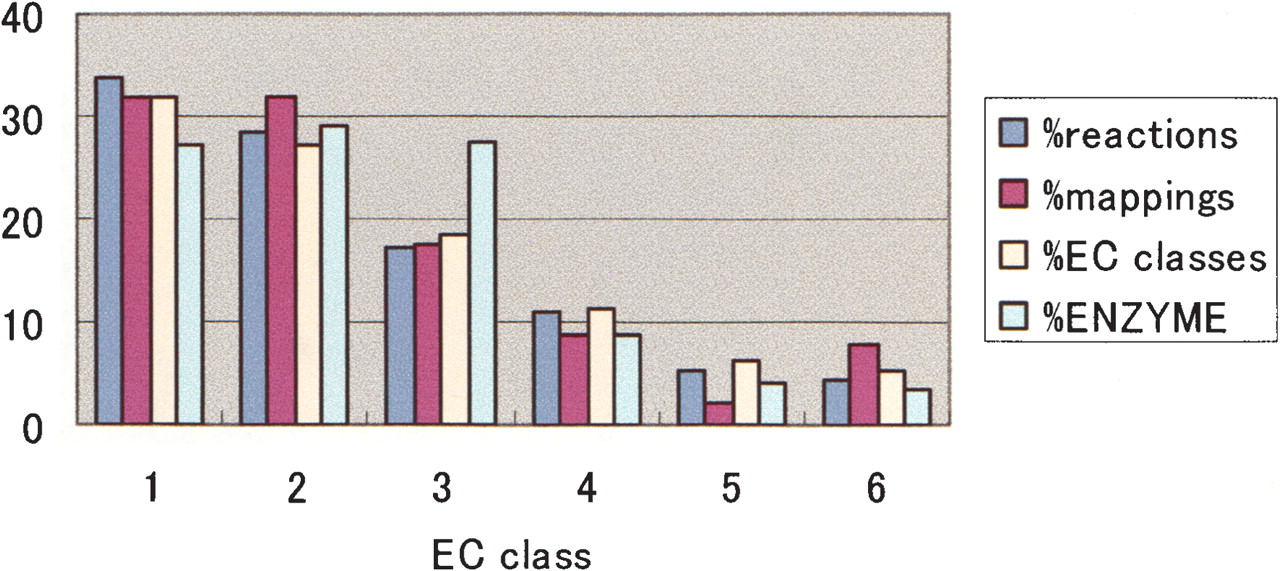
Figure 7
The number of reactions, mappings, and EC sub-subclasses in the reference metabolism against the total number of EC sub-subclasses in the LIGAND database. The blue, red, and yellow bars (%reactions, %mappings, and %EC classes, respectively) signify the percent contribution of each EC class for all reactions, mappings, and EC sub-subclasses in the reference metabolism (the six classes total 100%); the skyblue bar (%reactions) signifies the percent contribution of the EC sub-subclasses in the LIGAND database.


