
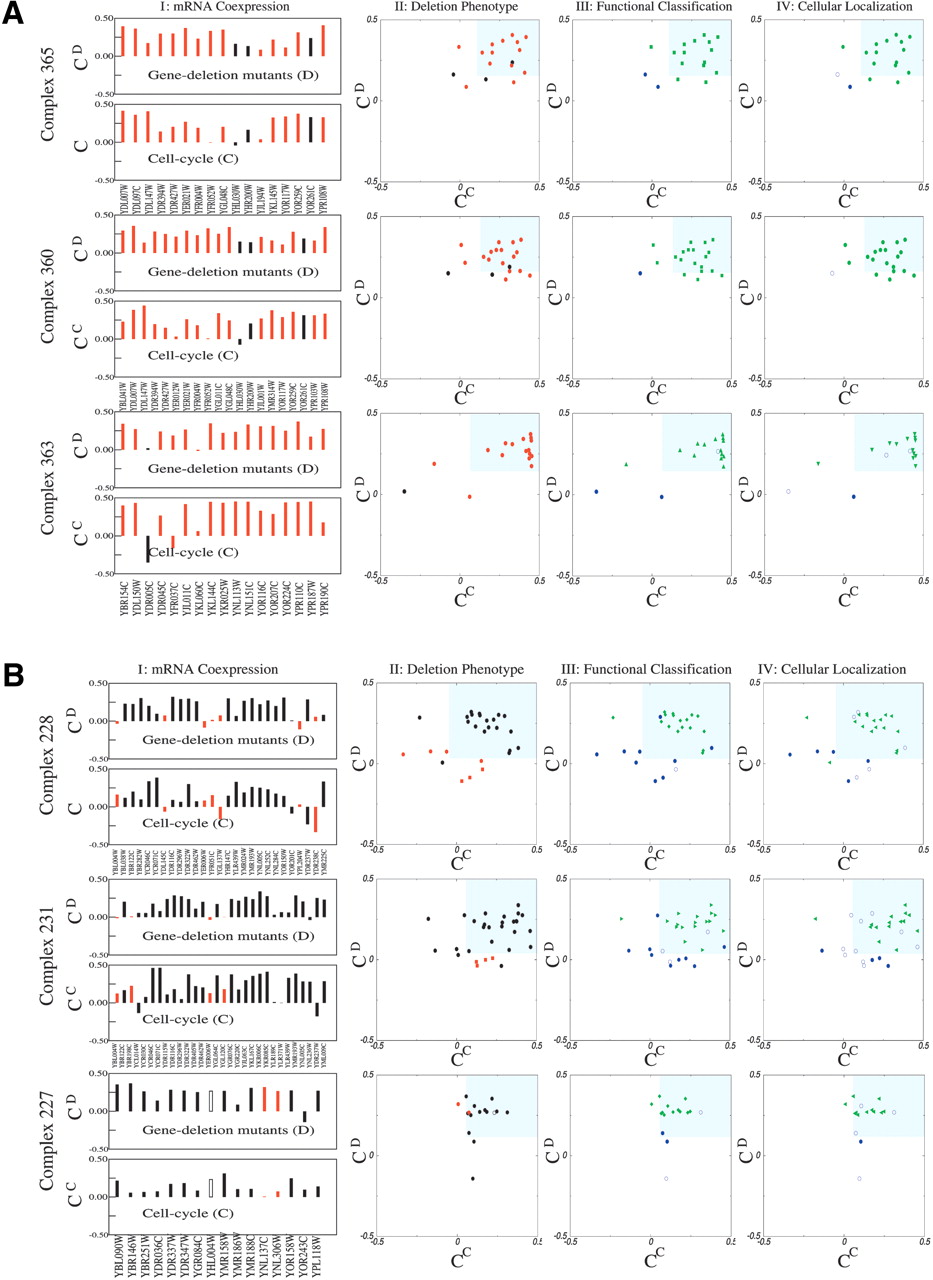
Characterizing three essential and nonessential complexes. (A, column I) mRNA coexpression patterns for three large complexes identified in Gavin et al. (2002). For each protein subunit (identified at the bottom of each panel), we show the average correlation coefficient for their corresponding relative mRNA expression level with all other subunits based on the microarray data obtained on gene deletion mutants (CD, top plot; Winzeler et al. 1999; Hughes et al. 2000), and cell cycle measurements (CC, bottom plot; Cho et al. 1998; Spellman et al. 1998). We denote by red the known essential proteins and by black the nonessential proteins. (Column II) Cross-correlation plot obtained by plotting for each protein i within the three selected complexes the cell cycle correlation coefficient CiC on the horizontal axis, and the gene deletion correlation coefficient CiD on the vertical axis. Each symbol corresponds to a single gene product (protein), the color reflecting its known deletion phenotype (red: essential; black: nonessential). The shaded area separates the highly coexpressed core proteins, the boundaries of the area being given by CiC = C̄C - σC and CiD = C̄D - σD. (Column III) The same coexpression plot as in column II, but the symbols are color-coded based on the functional classification of the corresponding proteins. The green symbols denote gene products that belong to the majority regarding their known functional role (Complexes 365 and 360: green proteins simultaneously belong to protein fate and subcellular localization; Complex 363: transcription) unfilled symbols denote proteins with unknown functional role; and the blue symbols denote those subunits that do not share the functional classification with the majority. (Column IV) Coexpression plot with proteins colored based on their known cellular localization. Green symbols denote those with the same subcellular localization, which is nucleus for all three complexes. Blue symbols denote proteins whose localization differs from the majority, and unfilled symbols represent those with unknown cellular localization. In columns II-IV, we used a two-dimensional representation to demonstrate that the essentiality-, functional-classification-, and cellular-localization-based separation is simultaneously present by using two widely different transcriptional data sets. A control plot with only the Cho et al. (1998) cell cycle data is shown in the Supplemental material. (B) The same as A, but for three complexes with predominantly nonessential subunits. In column II, we used red squares to denote those essential proteins that are part of the core of other essential complexes. In column III, the green symbols represent proteins participating in synthesis. In column IV, the green symbols denote proteins localized in the mitochondria for all three complexes.


