
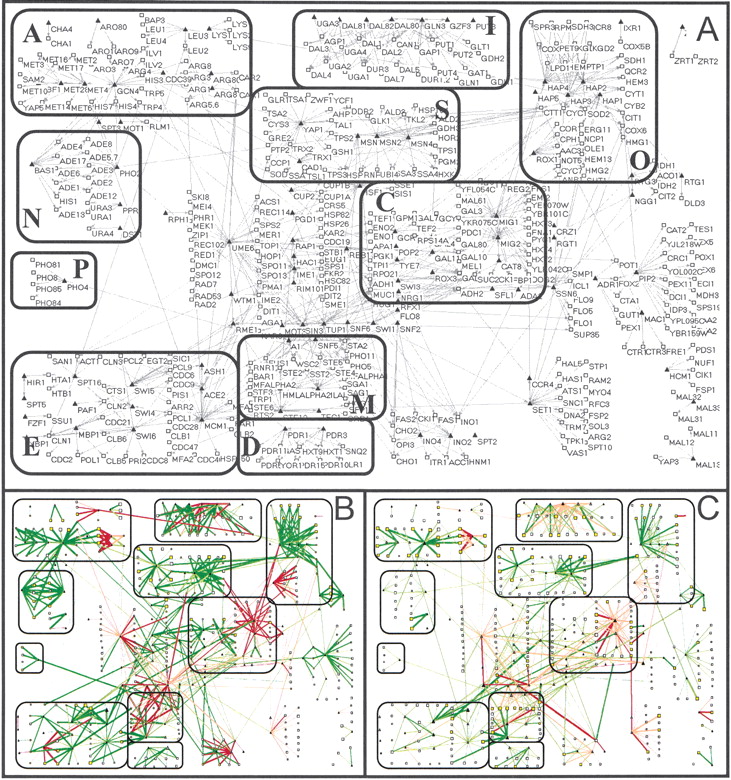
Figure 5
Maps of the yeast regulatory network indicating the magnitudes of the consistency metrics and consistent network elements at a P-value threshold of 0.01. See caption for Figure 4 for details. (A) Network maps with each gene labeled by its name. The subcomponents identified for the yeast network are (A, amino acid utilization; C, carbon utilization; D, drug response; E, cell cycle control; I, nitrogen utilization; N, nucleotide utilization; O, oxygen response; P, phosphate utilization; S, stress response). (B) Consistent target-target relationships. (C) Consistent regulator-target relationships.


