
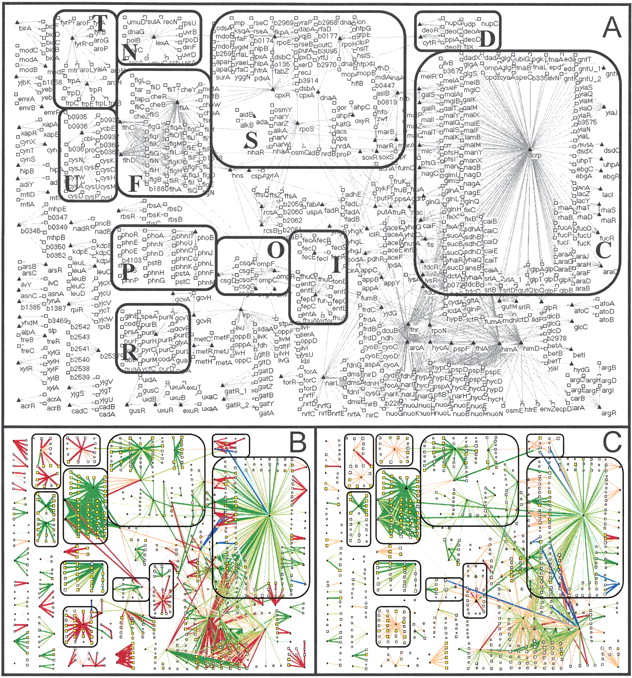
Maps of the Escherichia coli regulatory network indicating the magnitudes of the consistency metrics and consistent network elements at a P-value threshold of 0.01. (A) Network maps with each gene labeled by its name. Triangles correspond to regulators and boxes to targets. Particular subcomponents of the network are identified by labeled boxes (C, carbon utilization; D, DNA metabolism; F, flagellar biosynthesis; I, iron utilization; N, DNA damage; O, osmotic stress; P, phosphate utilization; R, purine utilization; S, stress response; T, Trp/Tyr utilization; U, sulfur utilization). (B) Consistent target-target relationships in the regulatory network. The widths of the links are proportional to RRM2 indicating how coherent the target gene expression is with the expression of other genes in the regulator module defined by the regulator involved in the interaction. For target genes (and regulators that are also targets of other regulators) the sizes of the nodes are proportional to RMRM2 indicating how coherent the target gene expression is with the expression of other genes in the same multiregulator module. The colors of the links indicate the mode of regulation (green, activation; red, repression; blue, dual). The darker shades of colors indicate that this component of the regulator module (for links) or multiregulator module (for nodes) is consistent with gene expression data (at P < 0.01). (C) Consistent regulator-target relationships in the regulatory network. The widths of the links are proportional to RRI2 indicating the correlation between regulator and target expression levels. The sizes of the nodes are proportional to RTM2 and describe how well the target expression level is explained by the regulator expression levels. The color scheme is the same as in B. The sign criterion was used to evaluate the consistency of regulatory interactions as described in the text.


