
Figure 7
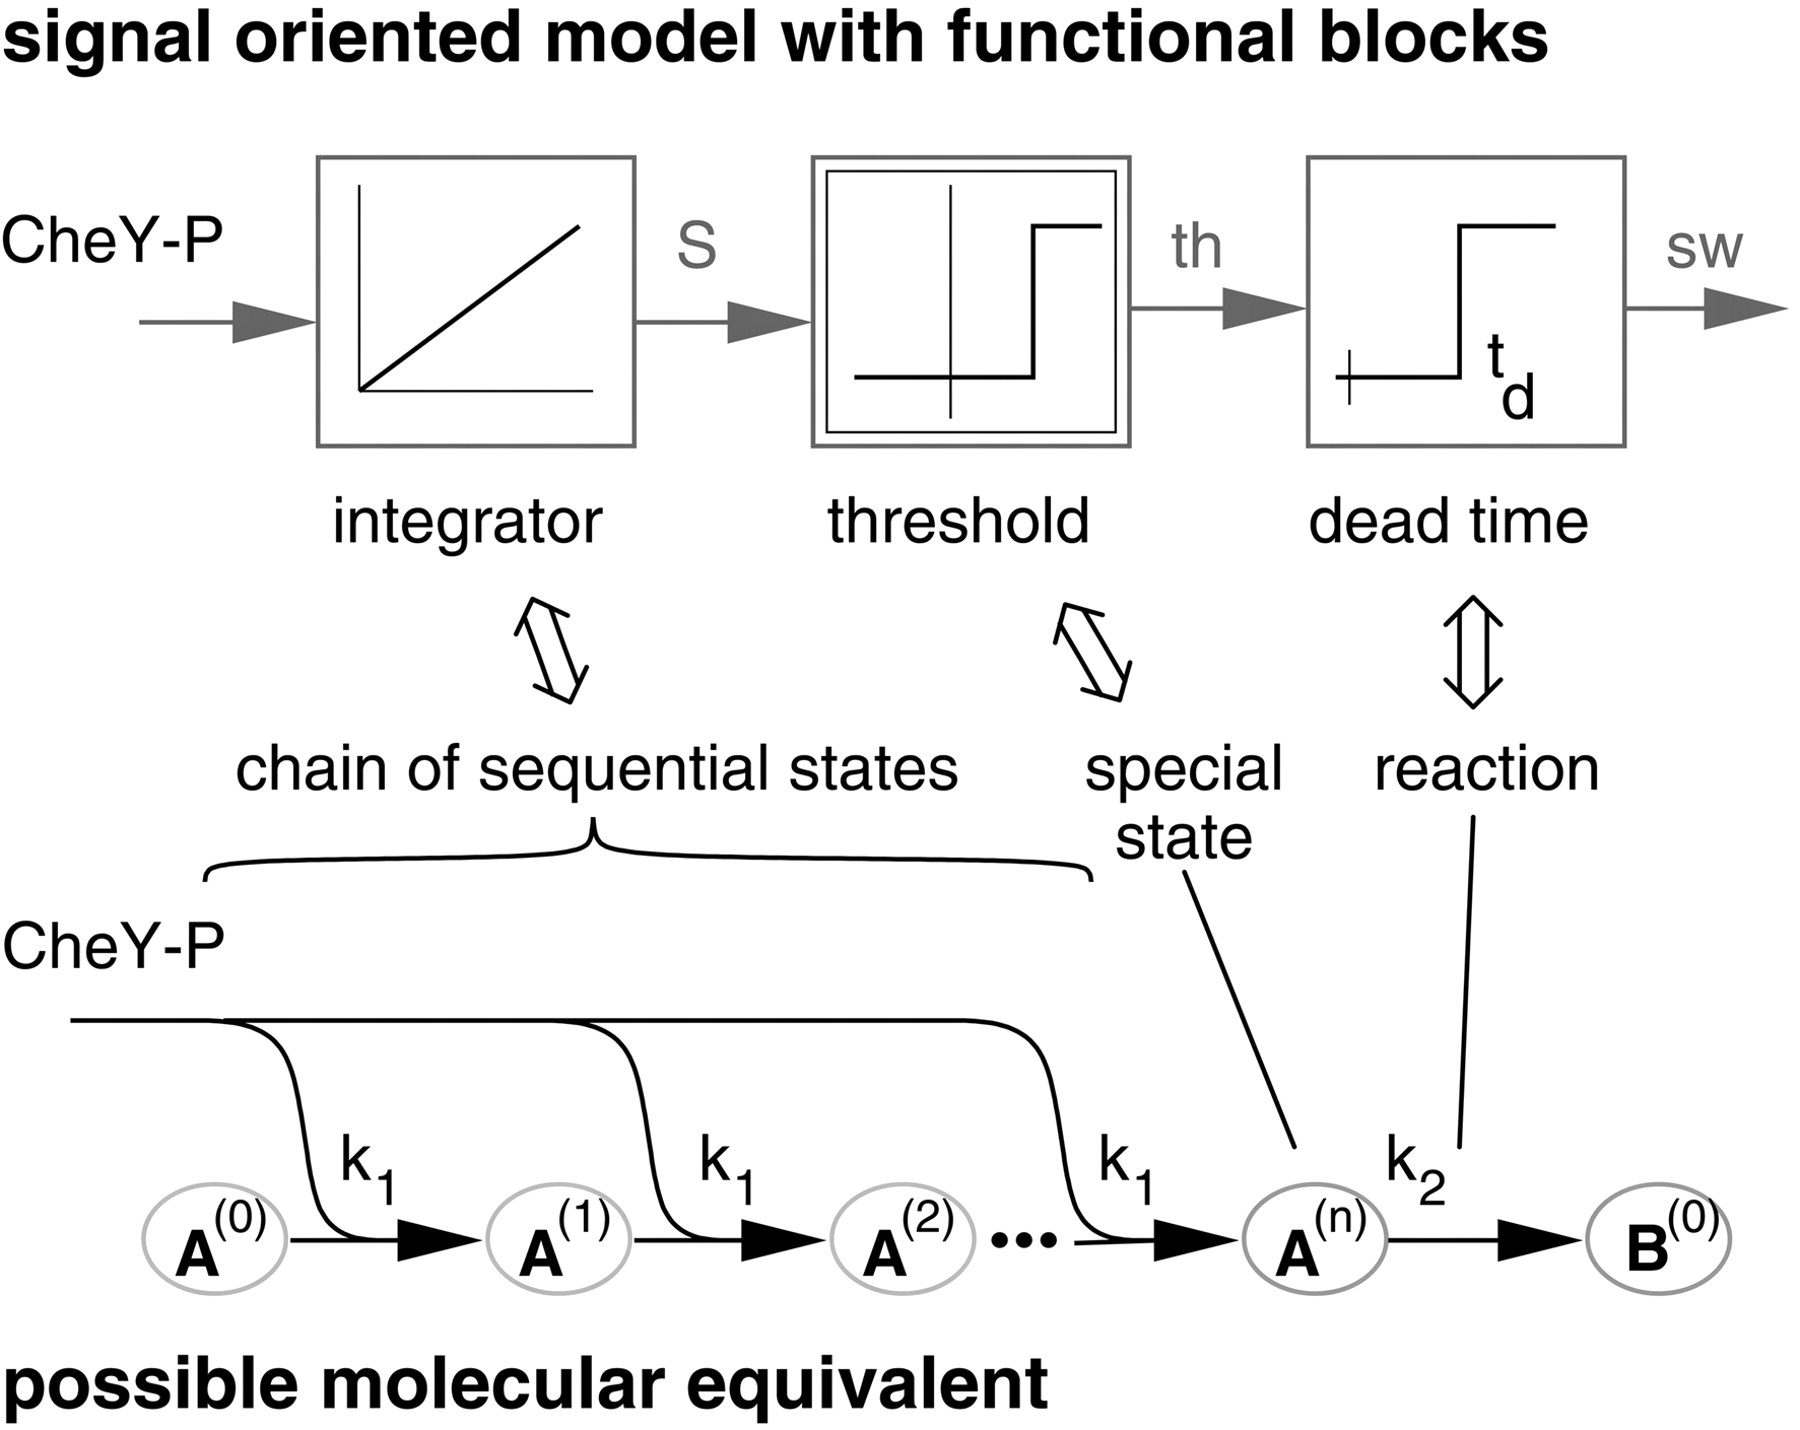
Correlation between the signal-oriented model b, describing the average behavior of the cells and the molecular model c, describing the individual behavior within a population of cells.
(Downloading may take up to 30 seconds. If the slide opens in your browser, select File -> Save As to save it.)
Click on image to view larger version.
Correlation between the signal-oriented model b, describing the average behavior of the cells and the molecular model c, describing the individual behavior within a population of cells.
 CiteULike
 Delicious
 Digg
Digg Facebook
 Google+
 Reddit
 Twitter
