
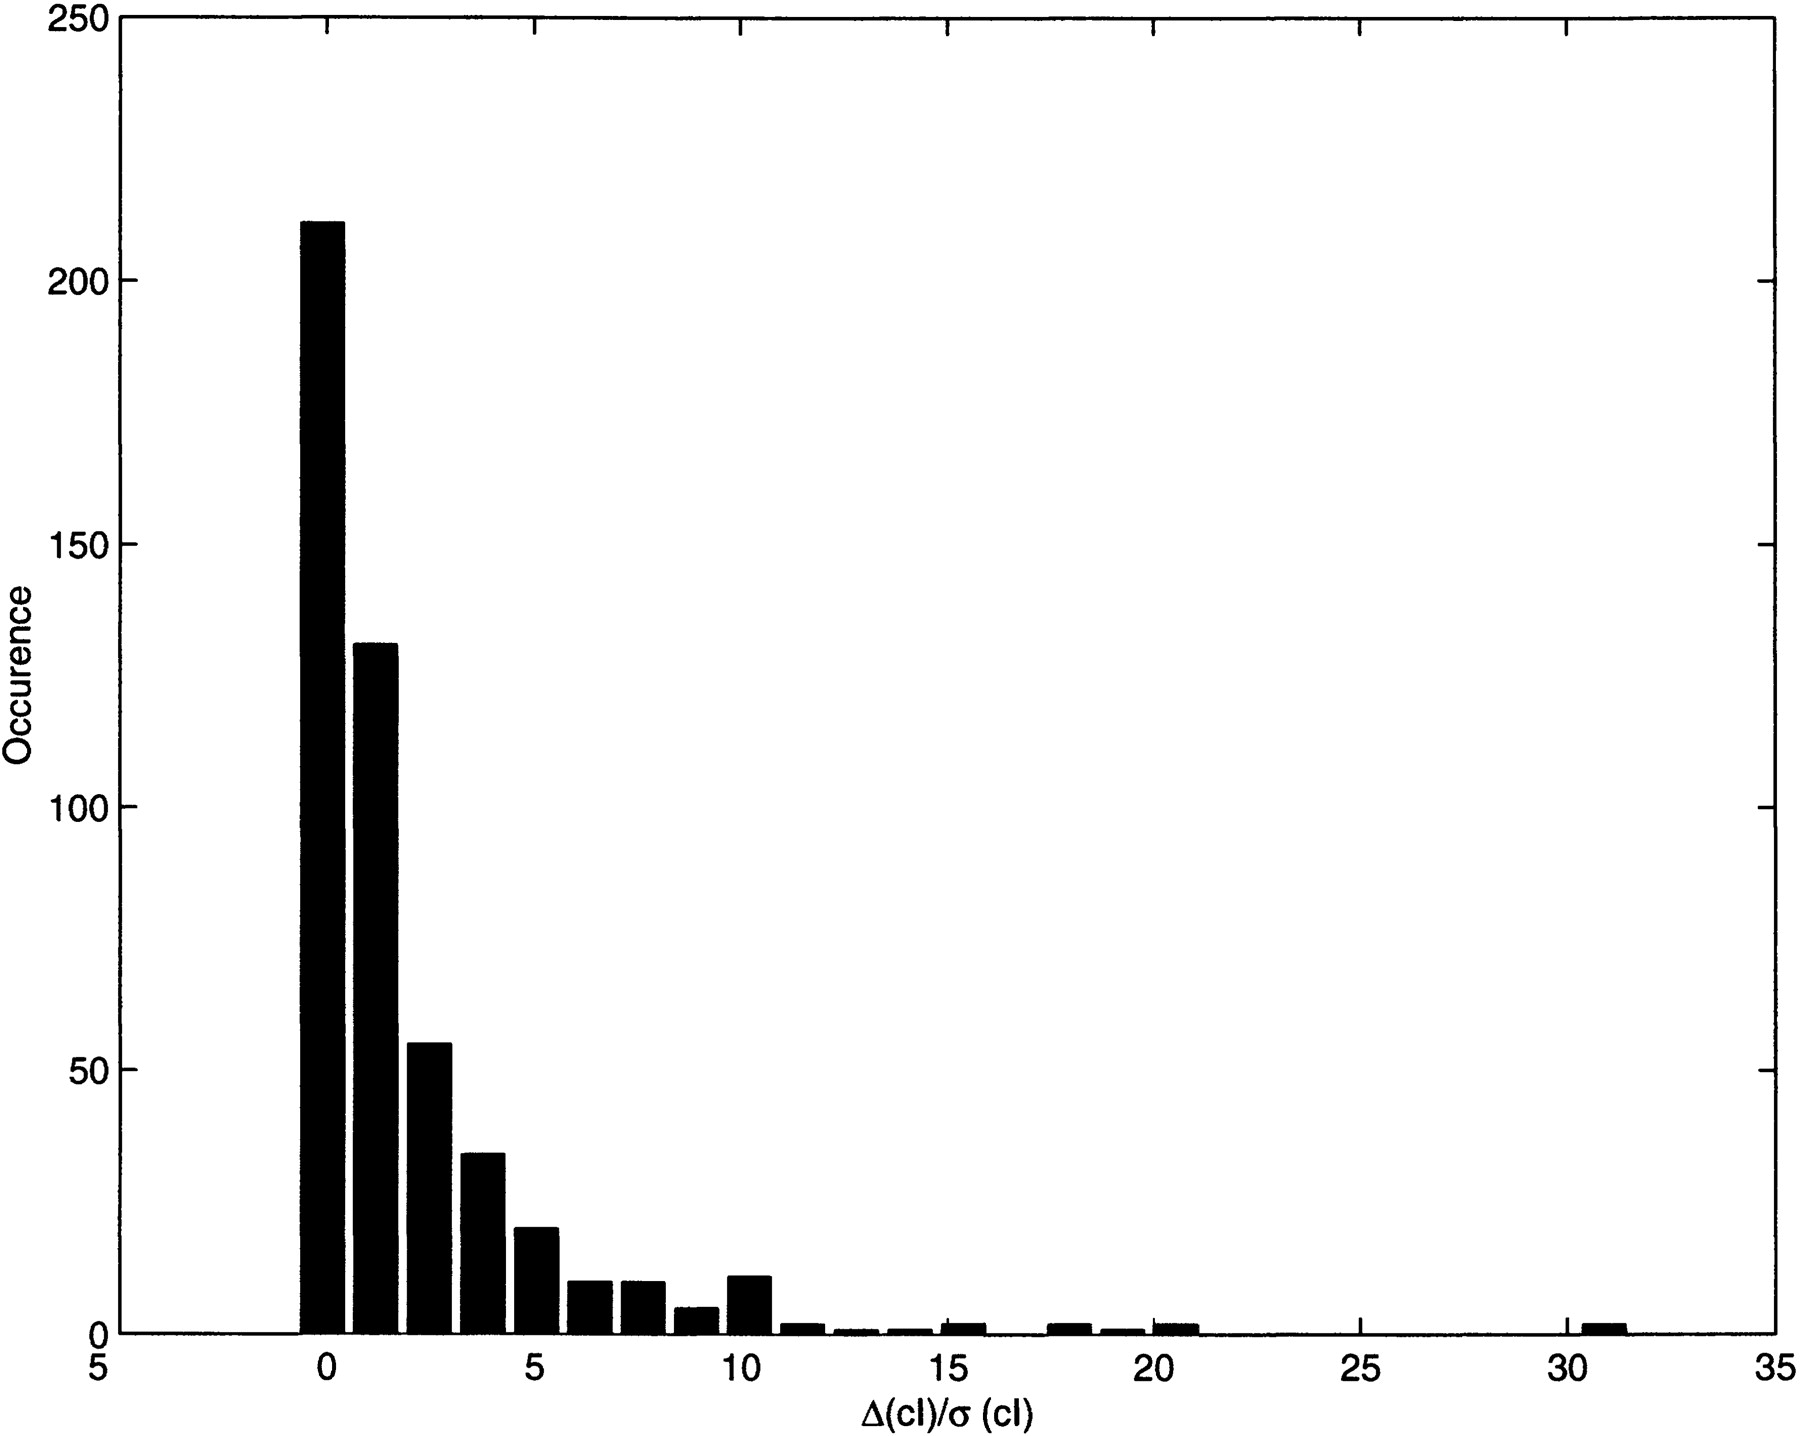
Figure 2
A histogram of the difference between the Monte Carlo simulations of D052 without effector and with IPTG added are shown for the stochastic parameter sampling. The difference in protein number of cI relative to the standard deviation of both simulations is shown.


