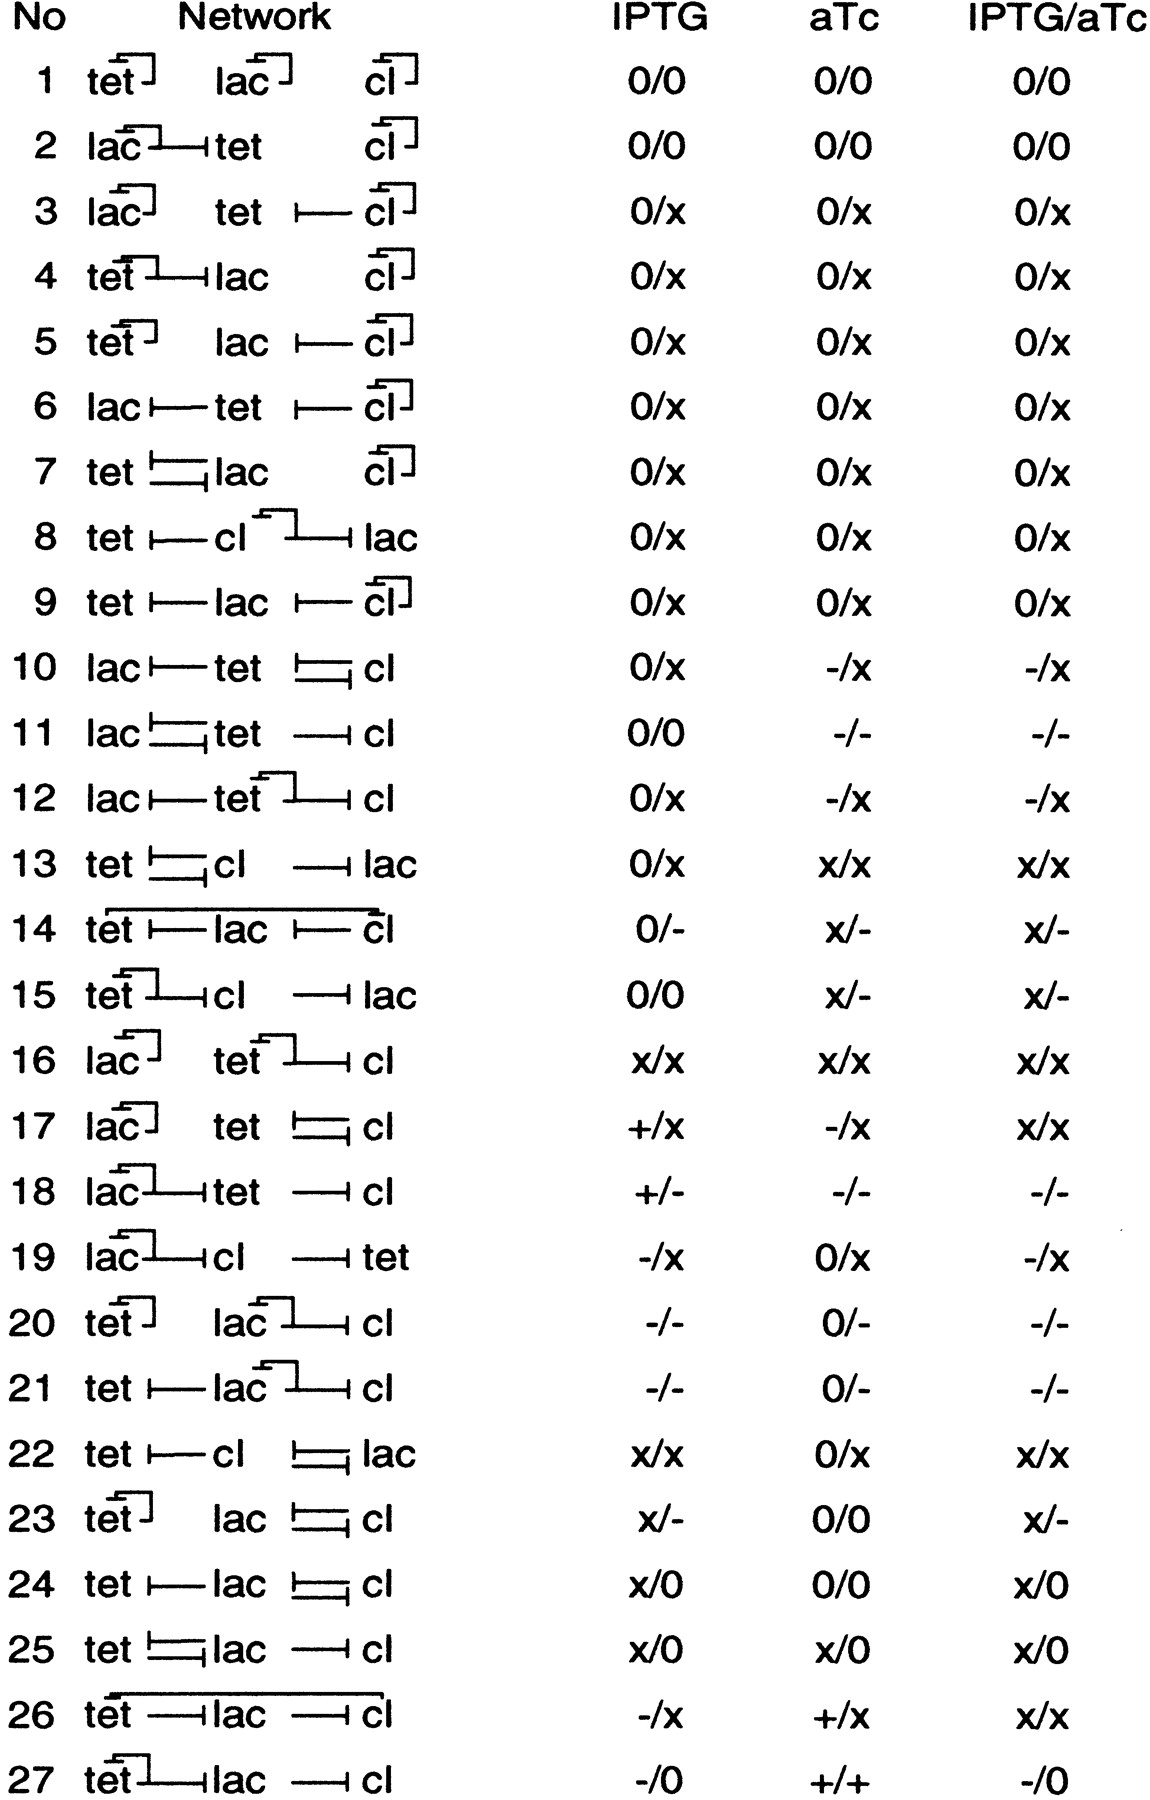
Limitations of Quantitative Gene Regulation Models: A Case Study

(Downloading may take up to 30 seconds. If the slide opens in your browser, select File -> Save As to save it.)

Click on image to view larger version.

Figure 1
Figure 1

Predicted behavior of all 27 synthetic repressor networks, consisting of the genes LacI, TetR, and cI. In the columns titled IPTG, aTc, and IPTC/aTc, GFP level changes are given (predicted here/observed by Guet et al. [2002]) as +, -, 0, or x (unknown).

This Article

  1. Genome Res. 13: 2391-2395

Preprint Server