
Figure 8
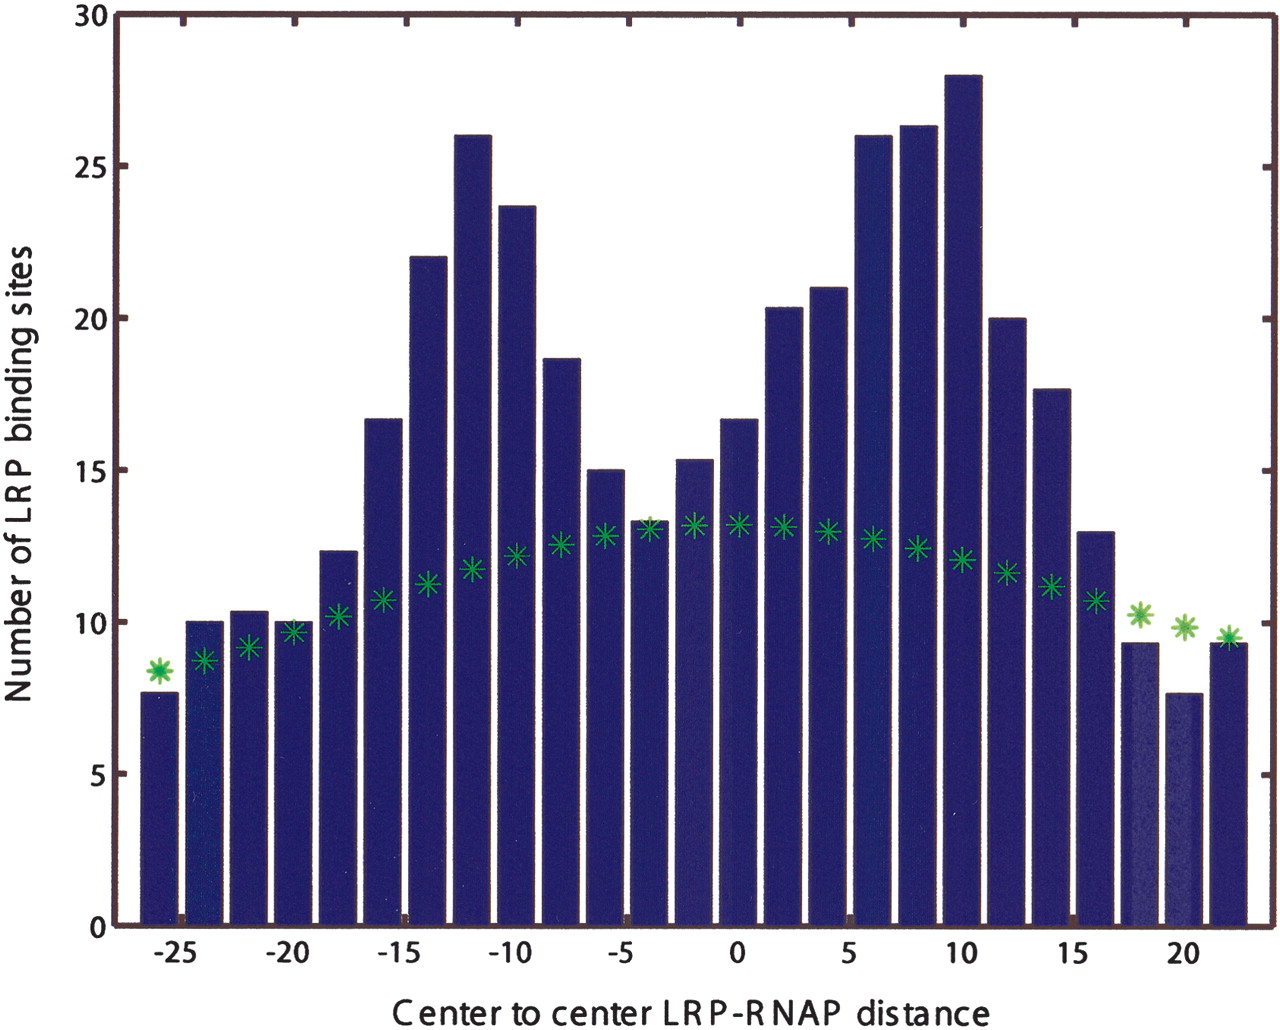
Positional distribution of candidate LRP sites (centers) relative to putative RNAP-σ70 sites (centers). (*) Estimated background distribution.
(Downloading may take up to 30 seconds. If the slide opens in your browser, select File -> Save As to save it.)
Click on image to view larger version.
Positional distribution of candidate LRP sites (centers) relative to putative RNAP-σ70 sites (centers). (*) Estimated background distribution.
 CiteULike
 Delicious
 Digg
Digg Facebook
 Google+
 Reddit
 Twitter
