
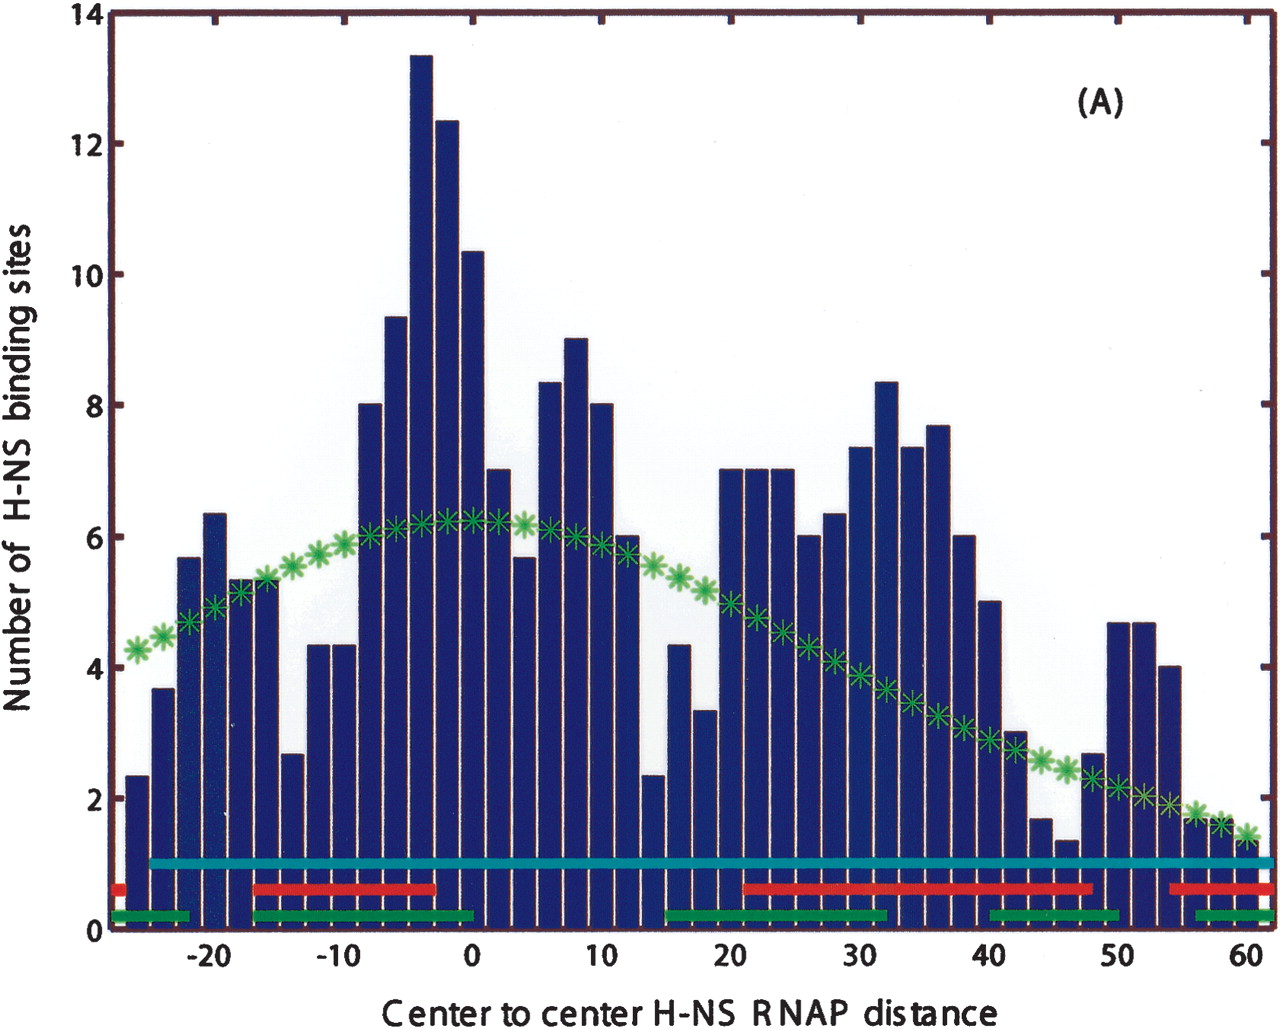
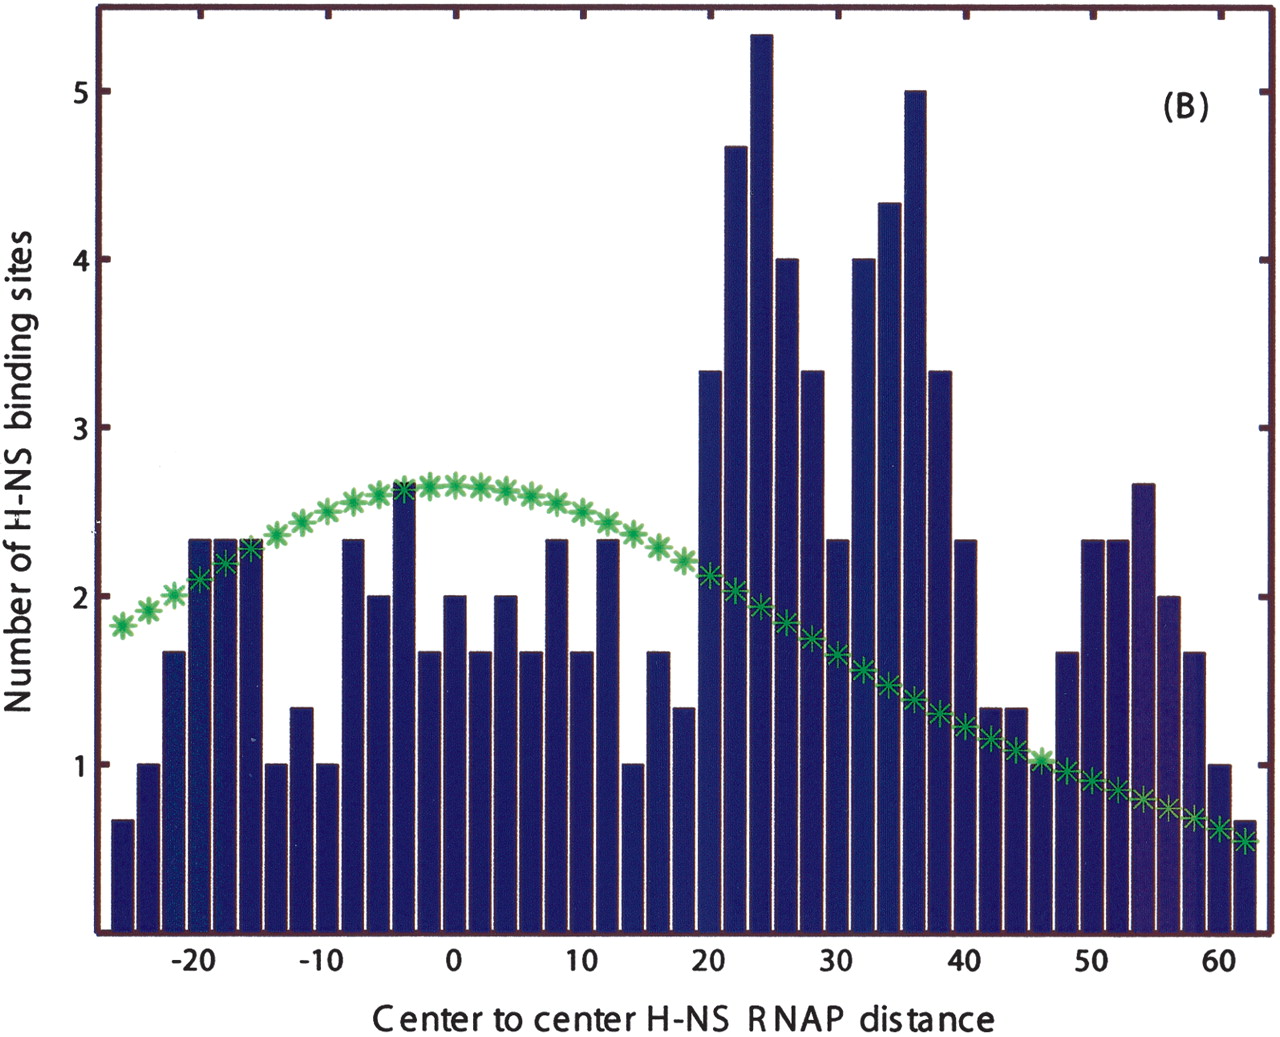
Positional distribution of candidate H-NS sites (centers) relative to putative RNAP-σ70 sites (centers). (A) All candidate H-NS sites within the represented range of distances. Note the significant peaks at relative positions near -4 and 8, which correspond to direct overlap, and at positions 25, 35, and 52, where H-NS is downstream of the promoter. Horizontal bars correspond to footprinted H-NS sites from Falconi et al. (1998), Lucht et al. (1994), and Soutourina et al. (1999). (B) Same as A but excluding weak candidate RNAP-σ70 promoters (i.e., sites with high E/µ “score”). The disappearance of the -4, 8 peaks indicates that they may function as activators. (*) Estimated background distribution.


