
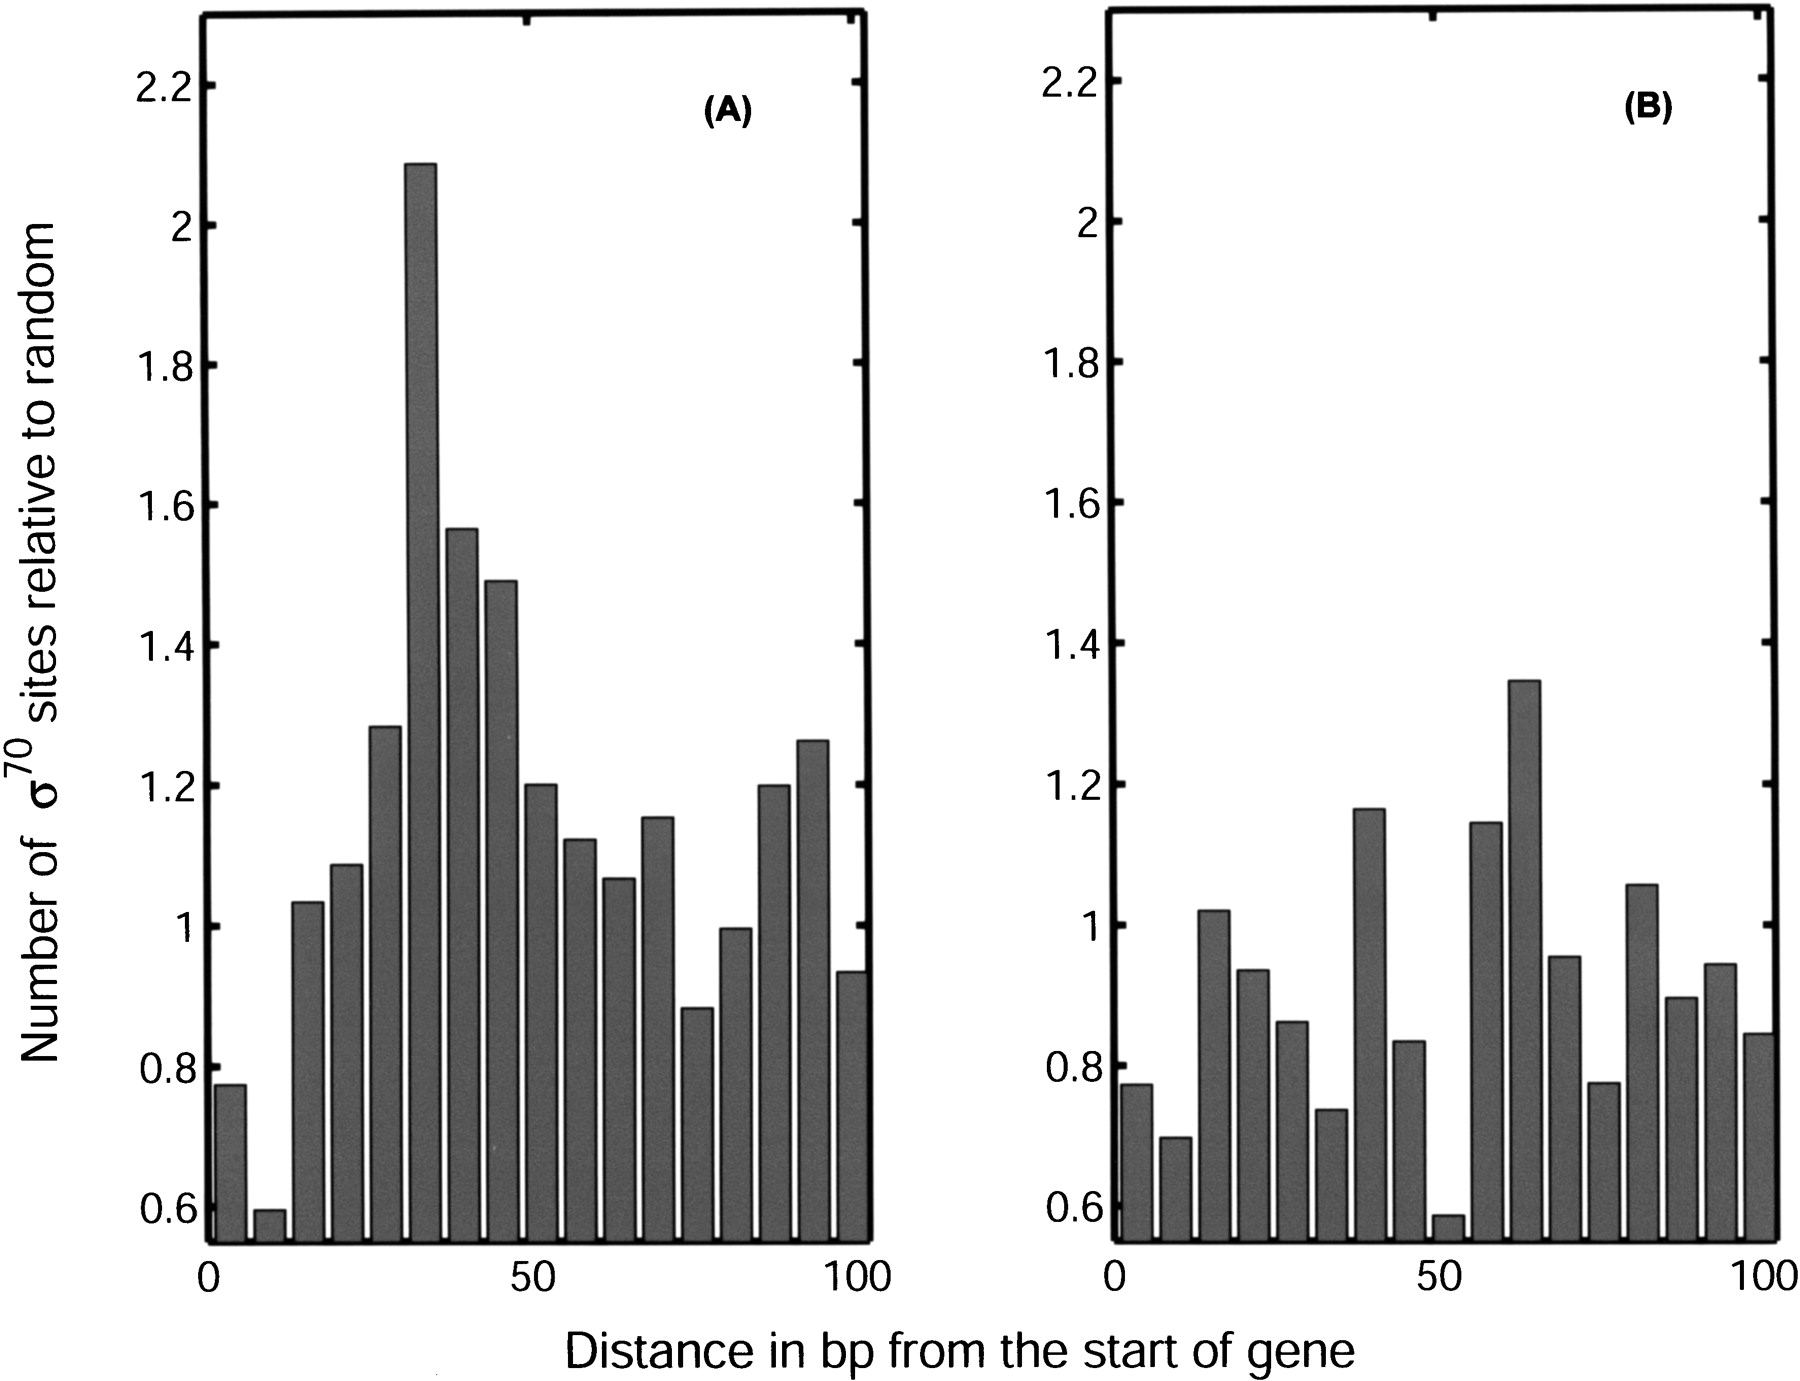
Figure 5
Histograms of positions of candidate σ70 binding sites relative to the nearest downstream ORF. Distance is measured from the 3′ end of the binding site. (A) Histogram corresponding to putative promoter and gene located on the same strand; (B) on opposite strands. The positional distribution of candidate σ70 promoters peaks at 33 bp upstream of the ORF only in the functionally relevant, same strand, configuration.


