
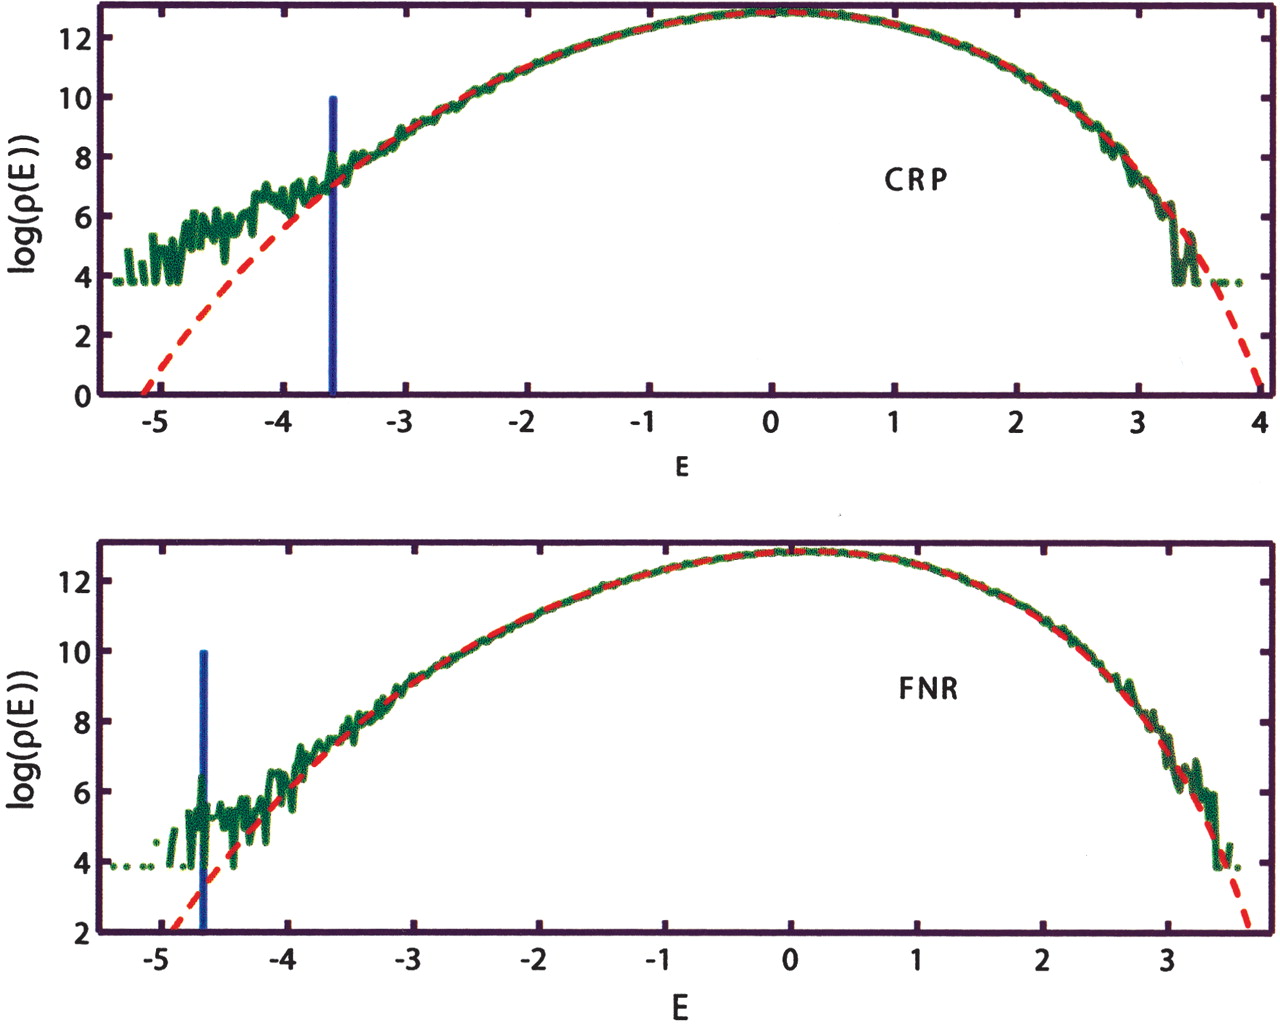
Figure 4
Comparison of the empirical and the model genomic background (MGB) binding energy distributions. The empirical distributions obtained by computing E = ϵ · S for all S in the non-ORF segments of the E. coli K12 genome with ϵ estimated for CRP and FNR. The MGB includes nearest-neighbor correlations, and the corresponding theoretical distribution is computed as described in Supplemental Appendix A. Both cases exhibit clear overrepresentation of the strongly bound sites. Vertical blue lines indicate the binding threshold estimated on the basis of the known binding sites.


