
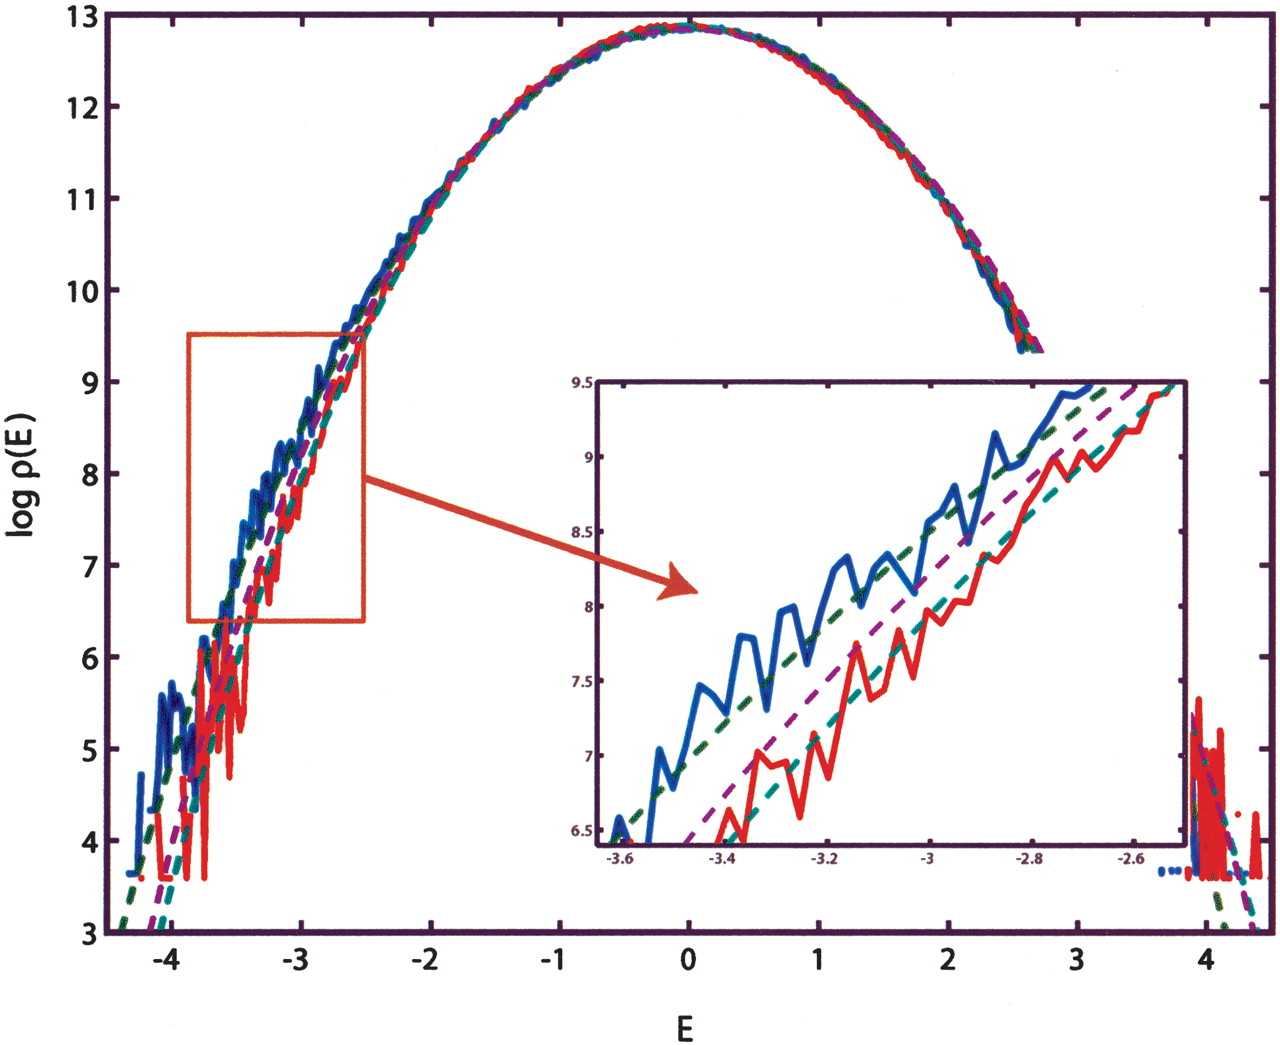
This figure illustrates the importance of the correlation effects in genomic background statistics. The histograms of binding
energies are obtained for a randomly chosen ϵ vector (blue) and its scrambled, that is, position-permuted, version  (red). The magenta curve is the theoretical estimate of the binding energy distribution based on a random nucleotide model
without correlations, but with the correct one-point statistics of bases. That estimate is the same for ϵ and
(red). The magenta curve is the theoretical estimate of the binding energy distribution based on a random nucleotide model
without correlations, but with the correct one-point statistics of bases. That estimate is the same for ϵ and  . The theoretical energy distribution for model background statistics, which includes correct one- and two- (nearest-neighbor)
base statistics, is different for ϵ and
. The theoretical energy distribution for model background statistics, which includes correct one- and two- (nearest-neighbor)
base statistics, is different for ϵ and  (green curves) is in a much better agreement with the empirical histograms.


