
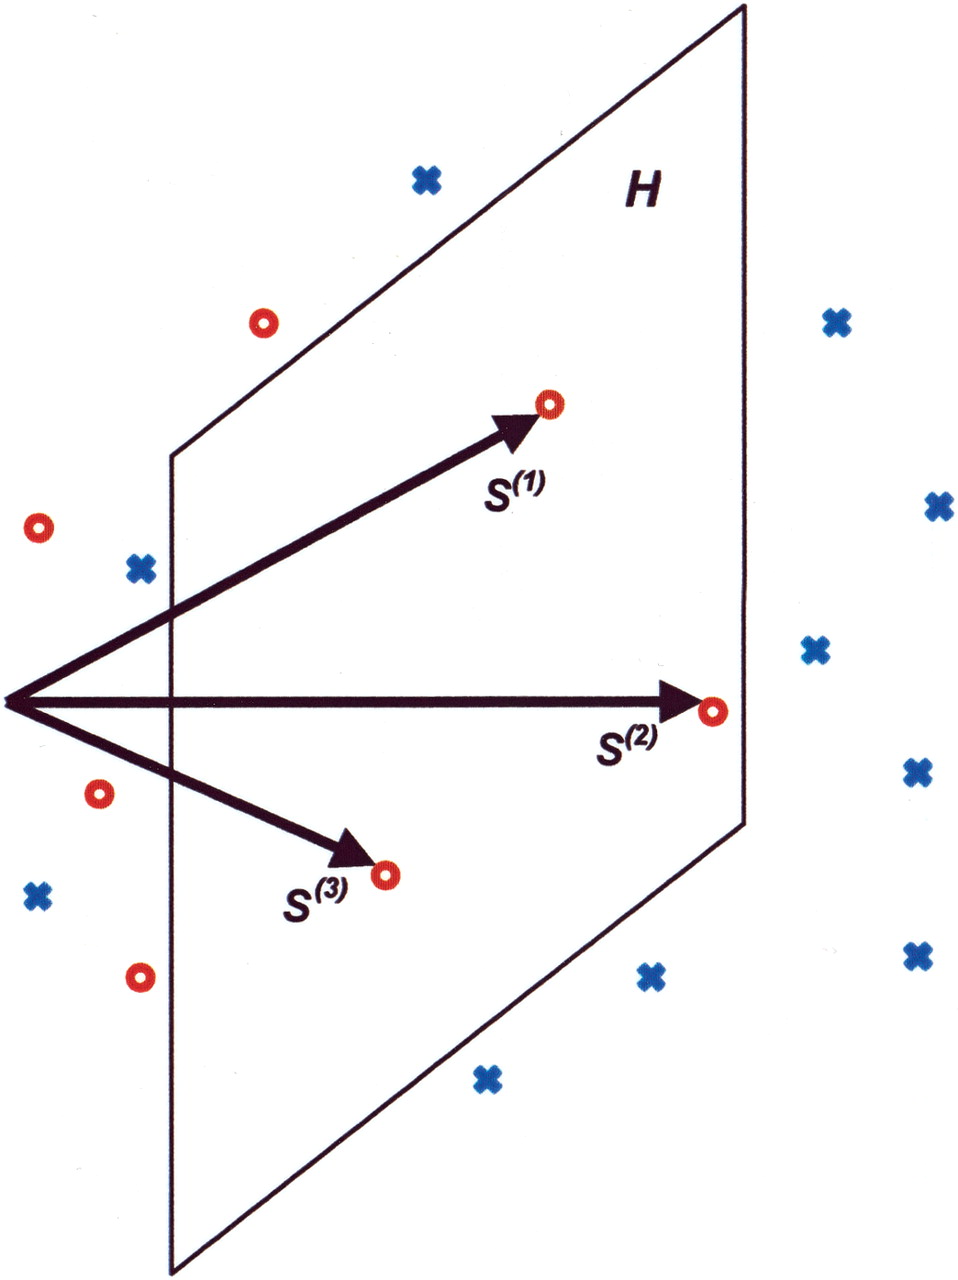
Figure 2
Schematic representation of the quadratic programming problem. Sequences are represented as points in multidimensional space. The red circles represent example binding sites, and blue crosses represent random sequences. The hyperplane H is specified by the energy matrix ϵ (here considered as a vector) and µ. All example points must be on or to the “left” of the hyperplane. Optimization moves the plane left until it gets “hung up” on the example points (S(1), S(2), S(3) on the figure) so as to minimize the number of random sequences below the binding threshold (i.e., lying to the left of H).


