
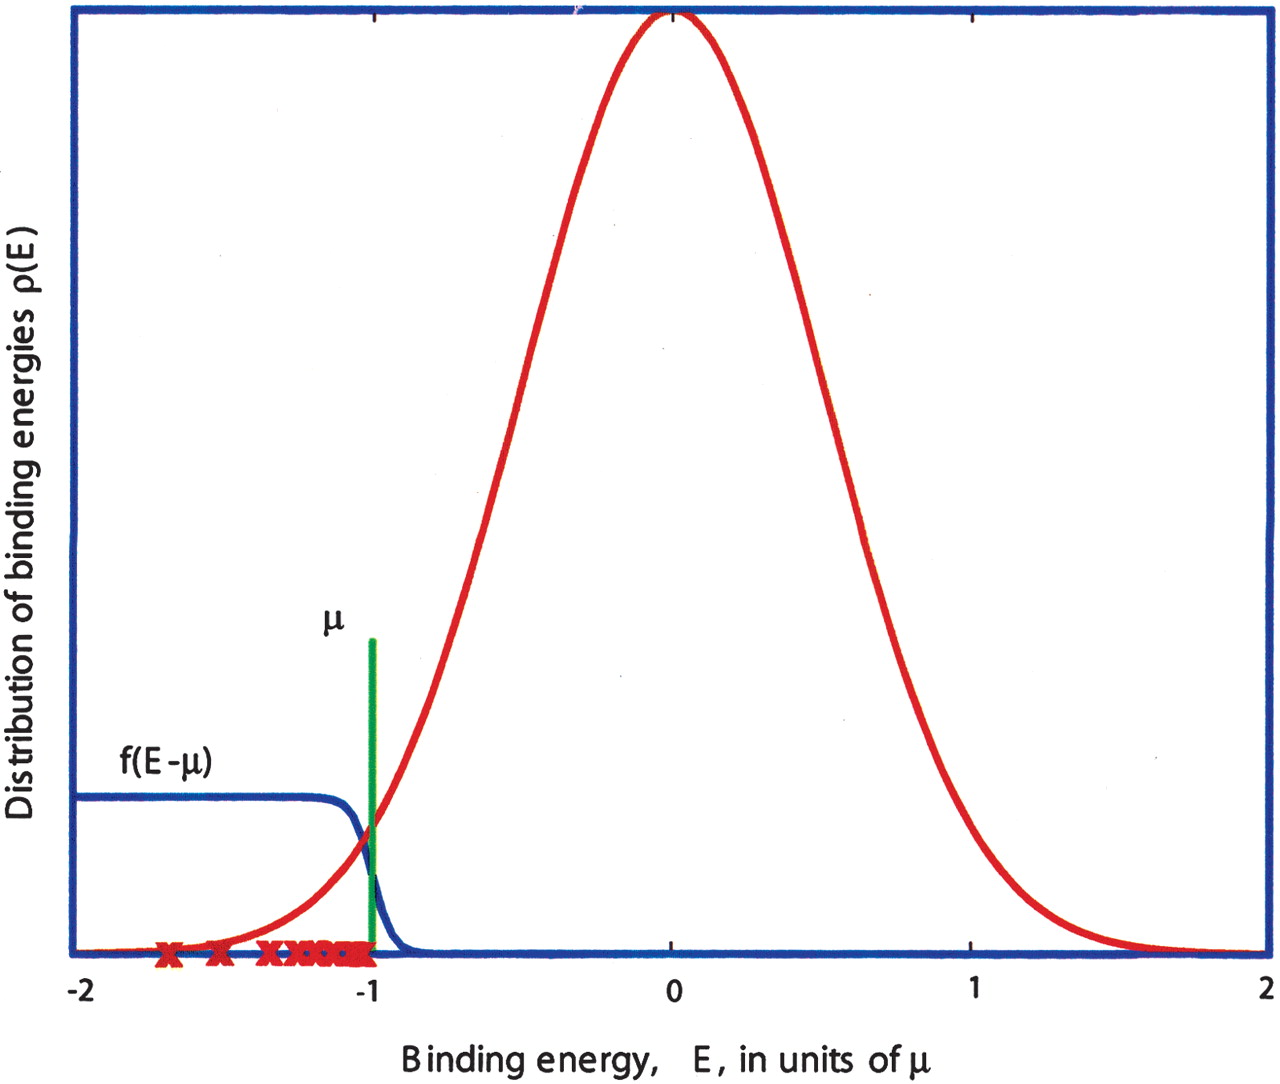
Figure 1
Distribution of binding energies (red curve) in the ensemble of random sequences is approximately Gaussian (although limited to the Emin, Emax interval set by the best and the worst binding sequences, respectively). The blue line represents the binding probability of TF present at a concentration corresponding to the chemical potential µ. The red crosses illustrate possible binding energies of example sequences.


