
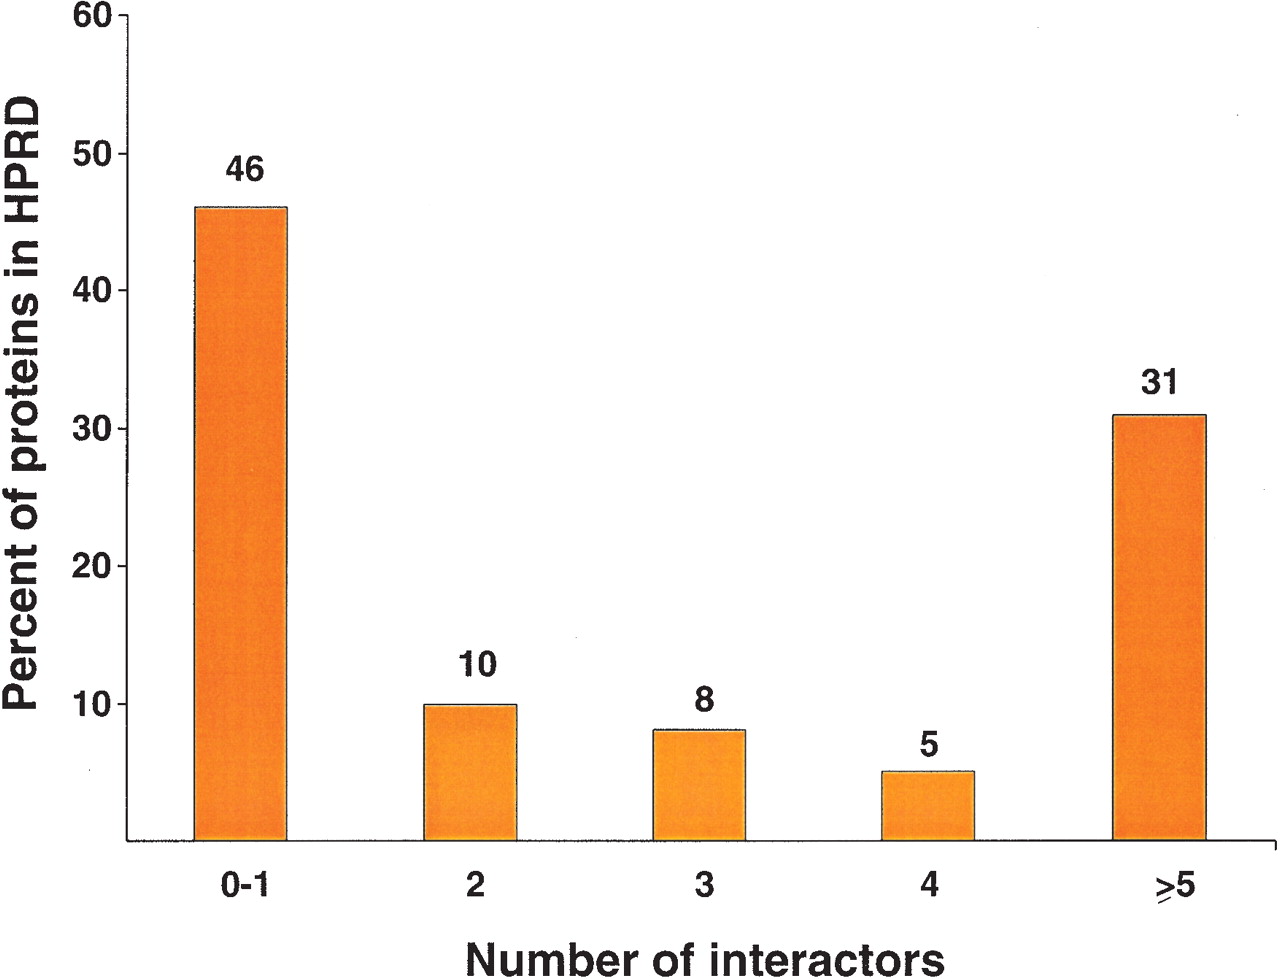
Figure 4
A distribution of the number of interaction partners per protein in HPRD. The histogram shows the distribution of proteins with zero to one, two, three, four, or five or more interaction partners out of a total of 10,534 interactions.


