
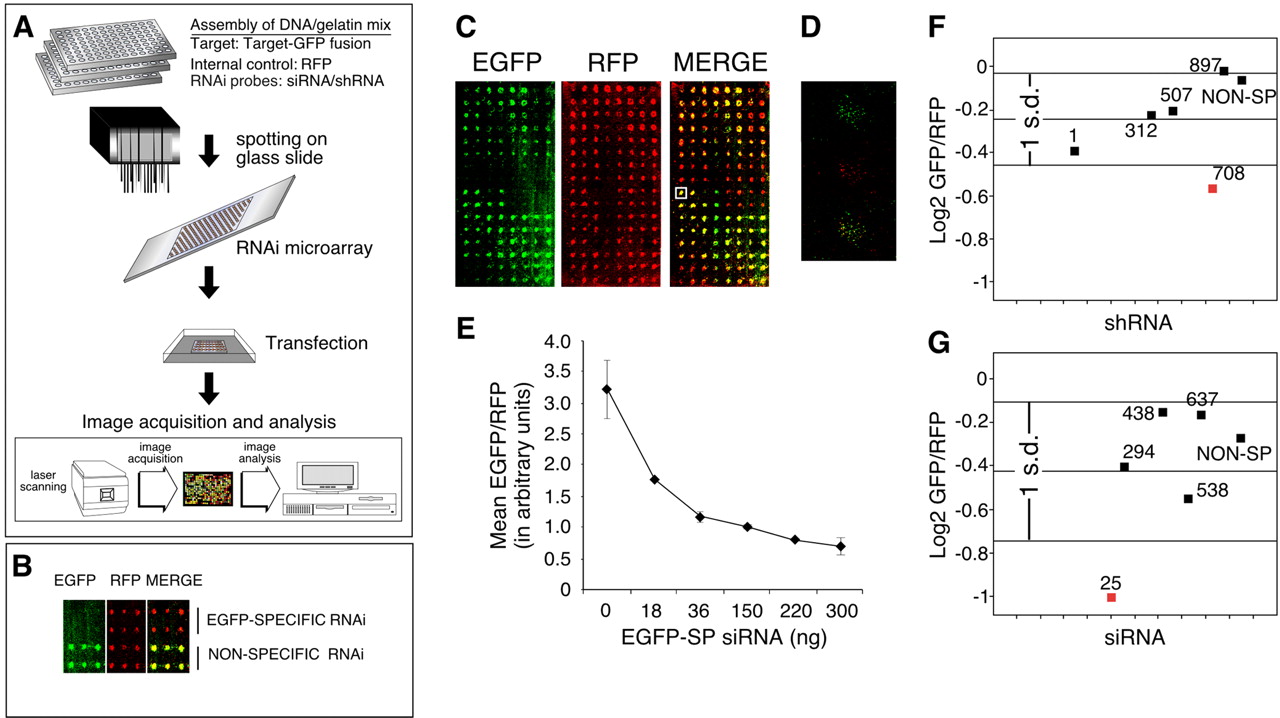
siRNA screens using microarray-based cell transfections. (A) Schematic showing manufacture and analyses of an RNAi microarray. (B) RNAi microarray showing that an effective EGFP specific siRNA results in the suppression of EGFP but not RFP expression. A nonspecific siRNA did not affect EGFP or RFP expression. (C) A laser scan image of EGFP- and RFP-expressing microarray. Each feature was 500 μM in diameter with a pitch of 750 μM. (D) Magnified image of a feature represented by a boxed area of an image from A. (E). Dose-dependent response of EGFP-specific siRNA in suppression of EGFP expression as quantitated by mean trimmed normalized values of EGFP/RFP mean intensities (n= 4). (F) Screen for identifying effective shRNA against MyoD gene. (G). Screen for identifying effective siRNA against MyoD. Normalized EGFP/RFP median intensities (y-axis) were log transformed, normalized (n= 4), and plotted against individual siRNA/shRNA probes (x-axis). In each case probes within and outside 1 standard deviation (s.d.) from the mean value were considered noneffective (marked in black) and effective (marked in red), respectively.


