
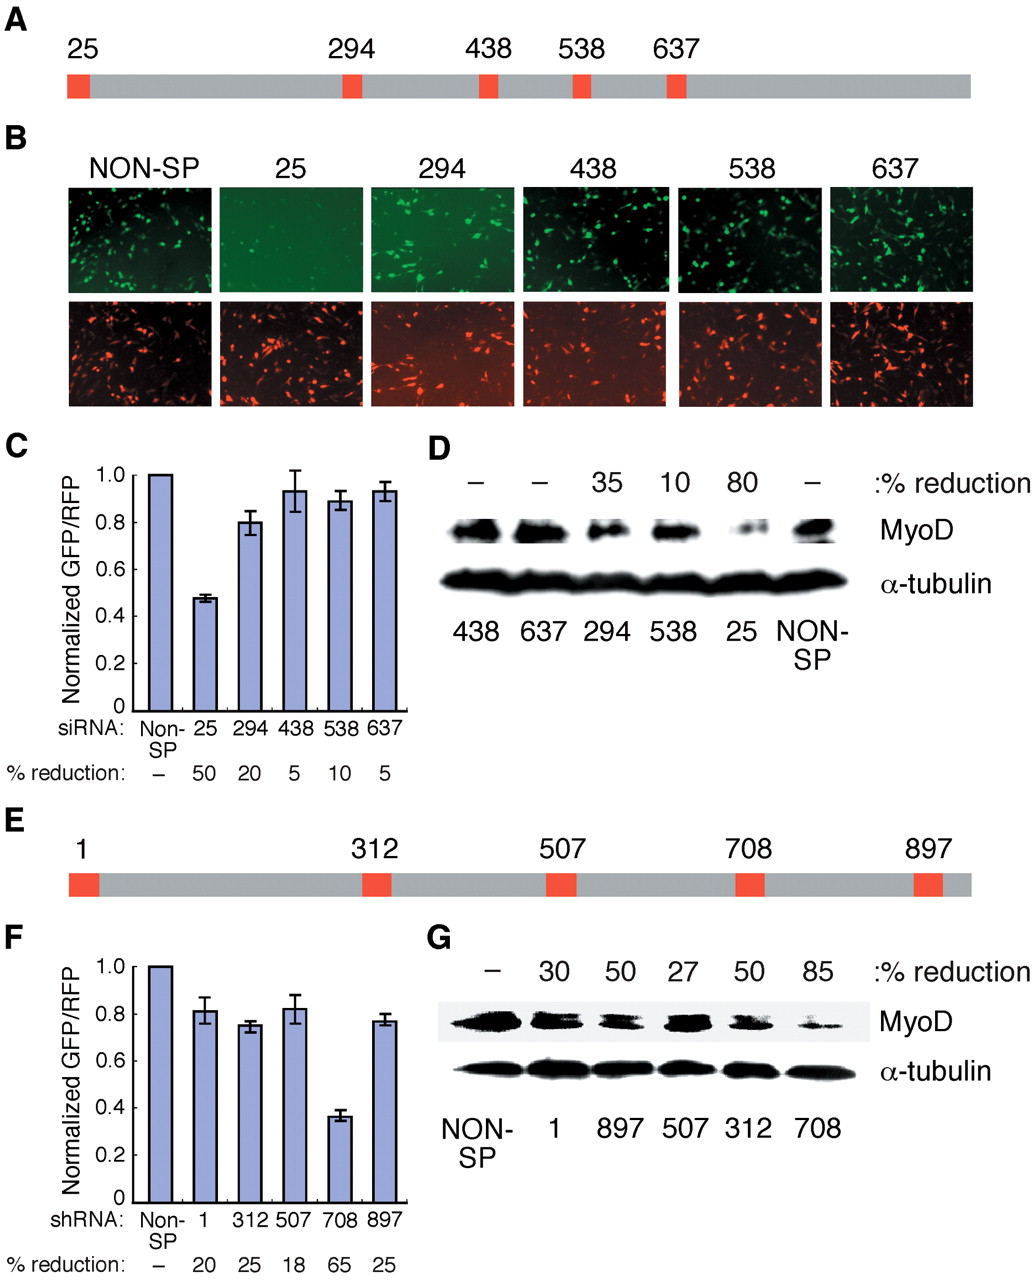
Correlation between siRNA/shRNA screening results and suppression of endogenous MyoD. (A) Schematic showing location of various siRNA probes against MyoD gene. The location of siRNA probes on the target sequences were assigned with respect to the translation start site (nucleotide position 1). (B) C2C12 cells were transfected with MyoD-EGFP, pDsRed2-N1 (internal control), and specific siRNAs against MyoD or a nonspecific siRNA as indicated. Upper and lower panels show EGFP and RFP expression, respectively, after 24 h of transfection. (C) Normalized relative amounts of EGFP and RFP for each siRNA. Percentage (%) reduction in GFP fluorescence is indicated below each siRNA (D) C2C12 cells were transfected with specific MyoD siRNAs or a nonspecific siRNA and subjected to Western blot analysis after 48 h of transfection for MyoD (upper panel) and α-tubulin (lower panel) protein. The percent reduction in band intensity relative to nonspecific control is shown. (E) Schematic showing location of the shRNAs along the sequence of the MyoD gene. (F) Normalized relative amount of EGFP and RFP for each shRNA. % reduction in GFP fluorescence is indicated below each shRNA. (G) C2C12 cells were transfected with specific MyoD shRNAs or a nonspecific shRNA and subjected to Western blot analysis after 48 h of transfection for MyoD (upper panel) and α-tubulin (lower panel) protein. shRNA against firefly luciferase and scrambled siRNA served as a nonspecific control. All of the blots were reprobed with anti-α-tubulin (Sigma) antibody to show equal loading.


