
Figure 3
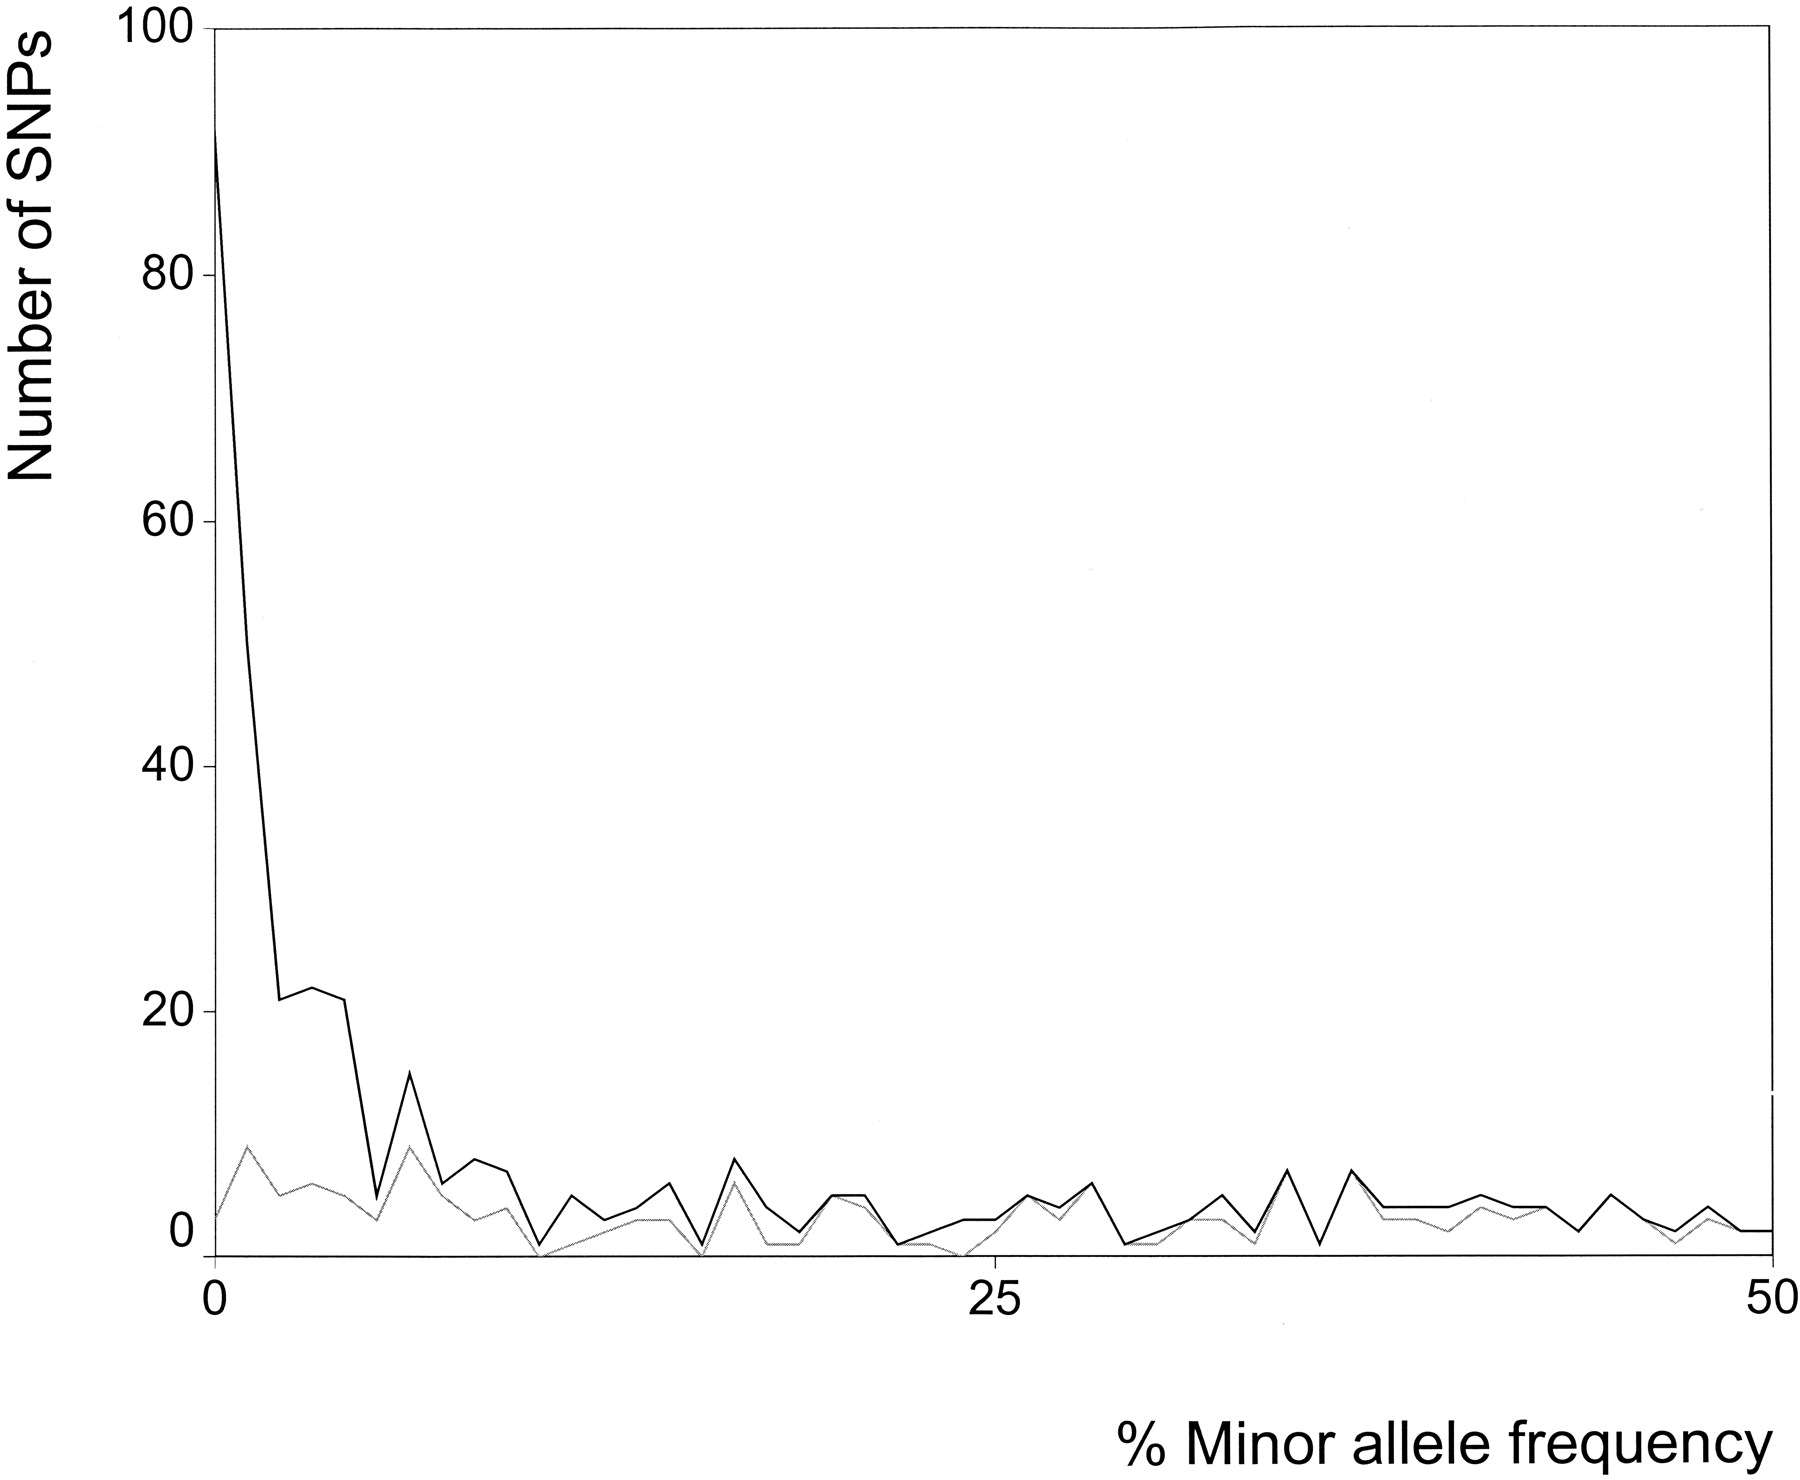
Distributions of observed SNPs (black line) and SNPs described in dbSNP (build 112; gray line) over their minor allele frequency.
(Downloading may take up to 30 seconds. If the slide opens in your browser, select File -> Save As to save it.)
Click on image to view larger version.
Distributions of observed SNPs (black line) and SNPs described in dbSNP (build 112; gray line) over their minor allele frequency.
 CiteULike
 Delicious
 Digg
Digg Facebook
 Google+
 Reddit
 Twitter
