
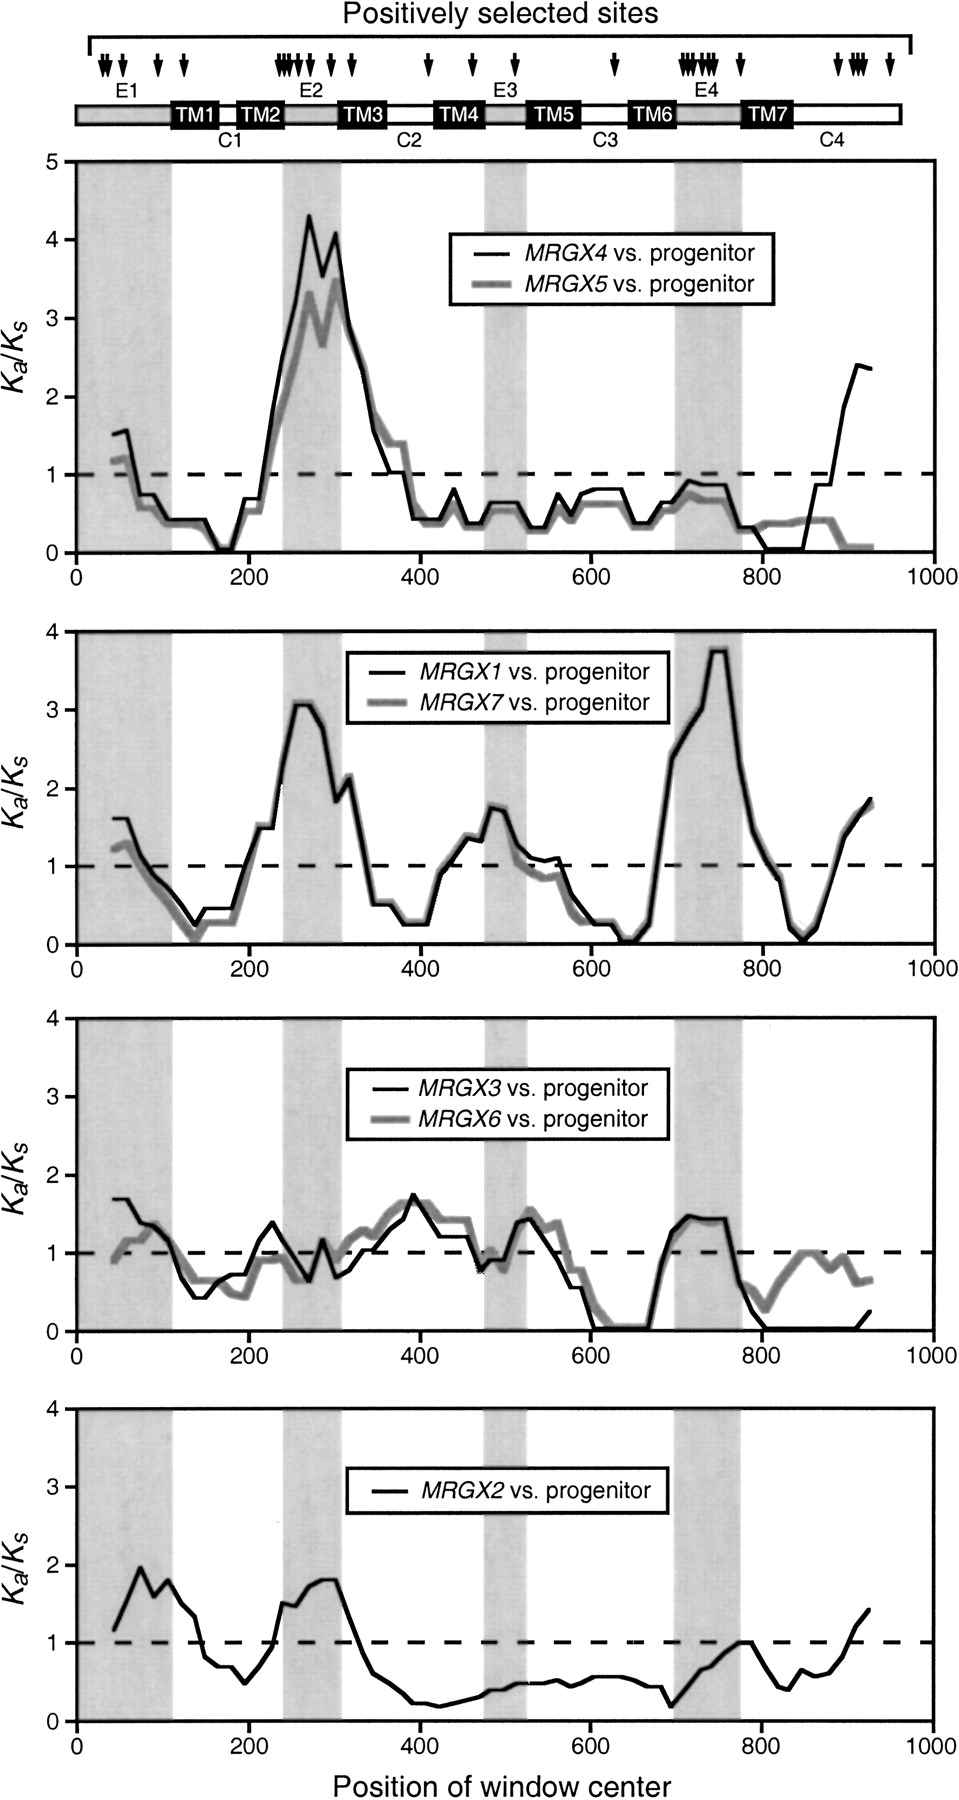
Figure 4
Sliding-window analysis of Ka/Ks performed between each human MRGX gene and the deduced sequence of the progenitor node (indicated in Fig. 1A). The four panels represent four distinct profiles in the seven comparisons. Vertical arrows at the top indicate positions of codons under positive selection as revealed by the Maximum Likelihood analysis (Yang 1998; these positions with respect to MRGX1 are 11, 12, 18, 32, 43, 78, 79, 82, 86, 91, 99, 108, 136, 153, 171, 208, 236, 239, 240, 244, 246, 247, 262, 298, 303, 305, 307, and 319).


